Our answer, up front
The best-supported statement today is: molecular change with age is not uniform—several independent lines of evidence agree on that. But the specific timetable of "two population-level molecular upheavals at 44 and 60" rests on an analysis pipeline that renders smooth change, and even pure noise, as twin peaks. Under a correctly constructed null hypothesis, the same waves appear anyway. This neither makes the original paper "entirely wrong" nor makes nonlinear aging research meaningless—what is weakened is the pair of year-precise numbers and the certainty built around them.
Five computations in this article each answer one question:
| What we did | What we found | What it did not answer |
|---|---|---|
| Rewrote the authors' sliding-window test per their protocol and compared against their saved outputs | 293,930 pairs of p-values with zero discrepancies; the count curve reproduced exactly at all 26 window centers | Faithful reproduction does not validate the inputs, let alone the interpretation |
| Same data, same test, but skipping the smoothing-interpolation step | Significant-gene counts were zero at all 26 centers | Does not prove the raw data carry no age signal (97 participants, limited power) |
| Valid permutation (shuffle ages first, then run the full pipeline), 100 runs, vs the authors' permutation (shuffle after smoothing), 200 runs | Waves appear routinely under the valid null; the observed curve sits inside the band at all 26 centers, and its swing is below the null median. Under the authors' scheme, 168 of 200 runs stay below 100 significant genes at every center | Cannot rule out that some real transition exists; the signal is simply indistinguishable from artifact |
| Pure noise mapped onto the real age distribution (100 runs × 2,000 genes); strictly linear ground truth as a control | Twin peaks appear routinely: all 100 runs grew twin peaks, locked at 43–46 and 60–65; under a linear truth the counts swing about four-fold with statistical power, and adding smoothing inflates the whole baseline | Simulated noise is synthetic, not calibrated to the measured noise structure |
| Resampled the 97 participants (100 runs) and looked at window effect sizes directly | Crest locations drift across more than a decade (crest 1 lands anywhere in 40–50, crest 2 in 57–65); effects are uniformly small (median |δ| 0.08–0.17), with modest enrichment above the pure-noise floor in the 45–50 and 56–59 windows | Reflects only the sampling variation of these 97 people; effect sizes carry no confounder adjustment, and the enrichment's attribution awaits an independent cohort |
Scope is limited to this study's population-level count curve and its statistical identification. We do not review the entire nonlinear-aging literature, give no age-timed health advice, and do not extrapolate molecular count peaks to disease, function, or lifespan outcomes.
Where the claim came from, and where it stands now
In August 2024, Shen et al. published a longitudinal multi-omics study in Nature Aging: 108 participants aged 25–75, followed for a median of 1.7 years, with each person's repeated samples averaged into one cross-sectional profile of 11,305 molecular variables. The abstract reported "substantial dysregulation occurring at two major periods occurring at approximately 44 years and 60 years," a sentence that then circulated widely as the "aging cliffs." The previous edition of this site reported the claim at face value. Original paper
In June 2026, Carbonneau et al. posted a methodological preprint laying out three artifact mechanisms in this pipeline. Notably, the original paper's first and corresponding authors (Shen, Snyder) are co-authors of the critique. Critique preprint
On July 15, 2026, the journal posted an editorial note on the article page (verbatim):
Readers are alerted that, following further review by the authors and independent researchers, the reliability of some of the analyses used in this article to detect peaks of changes in molecular aging markers around certain ages is currently in question. … Appropriate editorial action will be taken in due course.
As of our evidence cutoff (2026-09-17), no editorial action has landed: the paper is neither corrected nor retracted.
So the question for this article is narrower than "is the study famous": can the count curve that produced 44/60 stably separate real signal from pipeline behavior under reasonable analytic choices?
How a count curve is manufactured
The authors' pipeline has three steps (code archived at a fixed commit). Authors' code repository
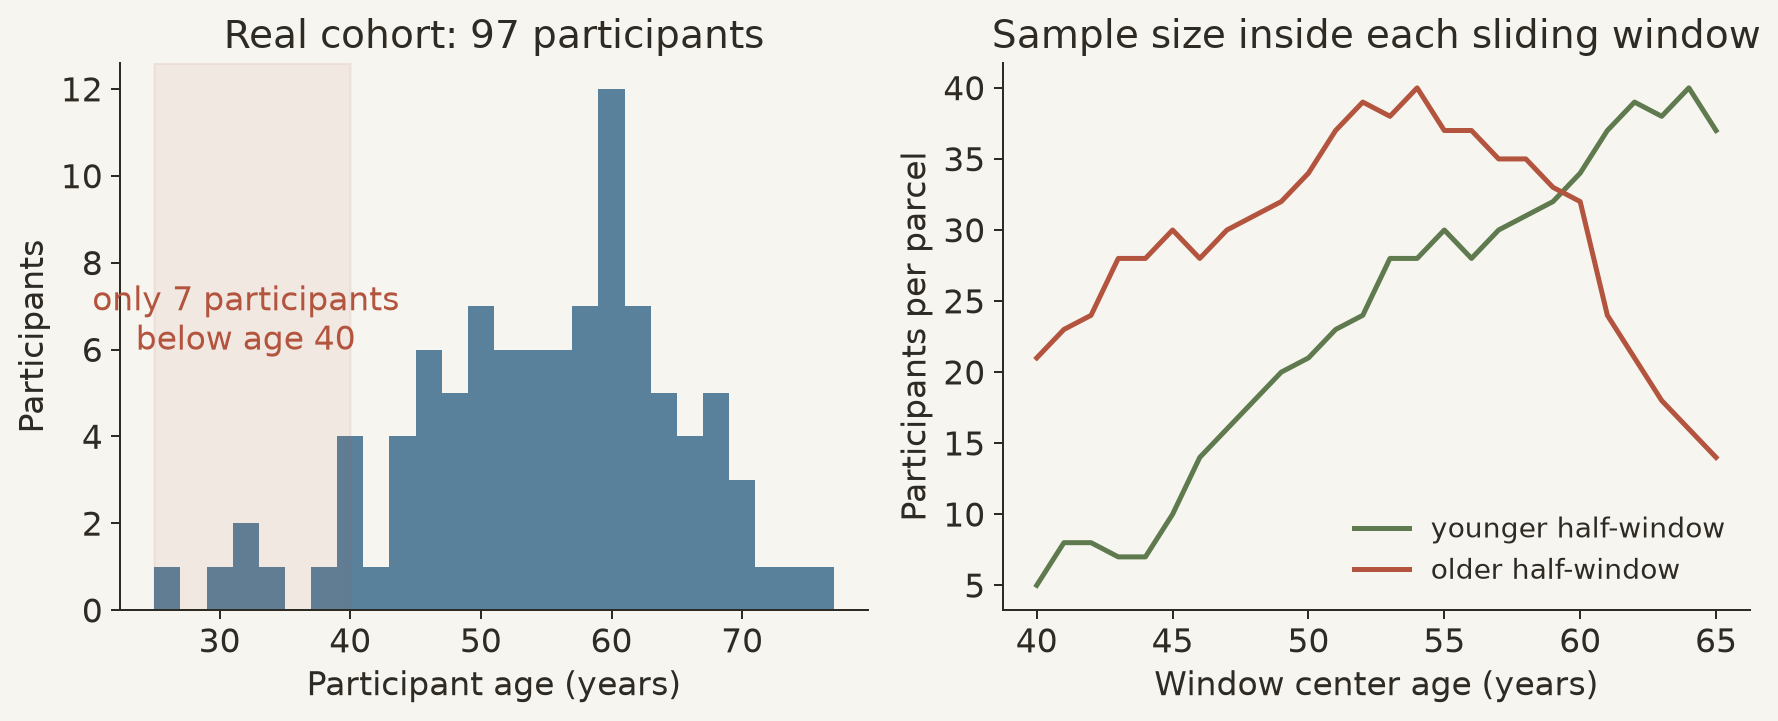
Step 1, cross-sectionalization: average each person's repeated samples into a single vector. The transcriptome matrix we recovered holds 8,556 genes × 97 participants (the subset of the 108 with transcriptome data), ages 25.9–75.2 (median 56.2), with only 7 participants below 40.
Step 2, smoothing interpolation (LOESS): fit a local regression of each variable on age and interpolate a value every 0.5 years from 26 to 75. From here on, the data are no longer 97 people but 91 equally spaced grid points.
Step 3, sliding-window counting (DE-SWAN): for each center age c, compare the "samples" in [c−10, c) against [c, c+10) with a Wilcoxon test per variable, apply Benjamini–Hochberg, and count the significant variables to form a curve.
Two design consequences are worth keeping in mind. First, smoothing makes adjacent grid points strongly correlated, so a large share of the "sample size" in each window comparison is manufactured by interpolation. Second, real participants are unevenly distributed across ages, so the power of the smoothing-plus-window machinery varies with age. Both return below.
First, reproduce: the curve matches exactly—and the baseline is startling
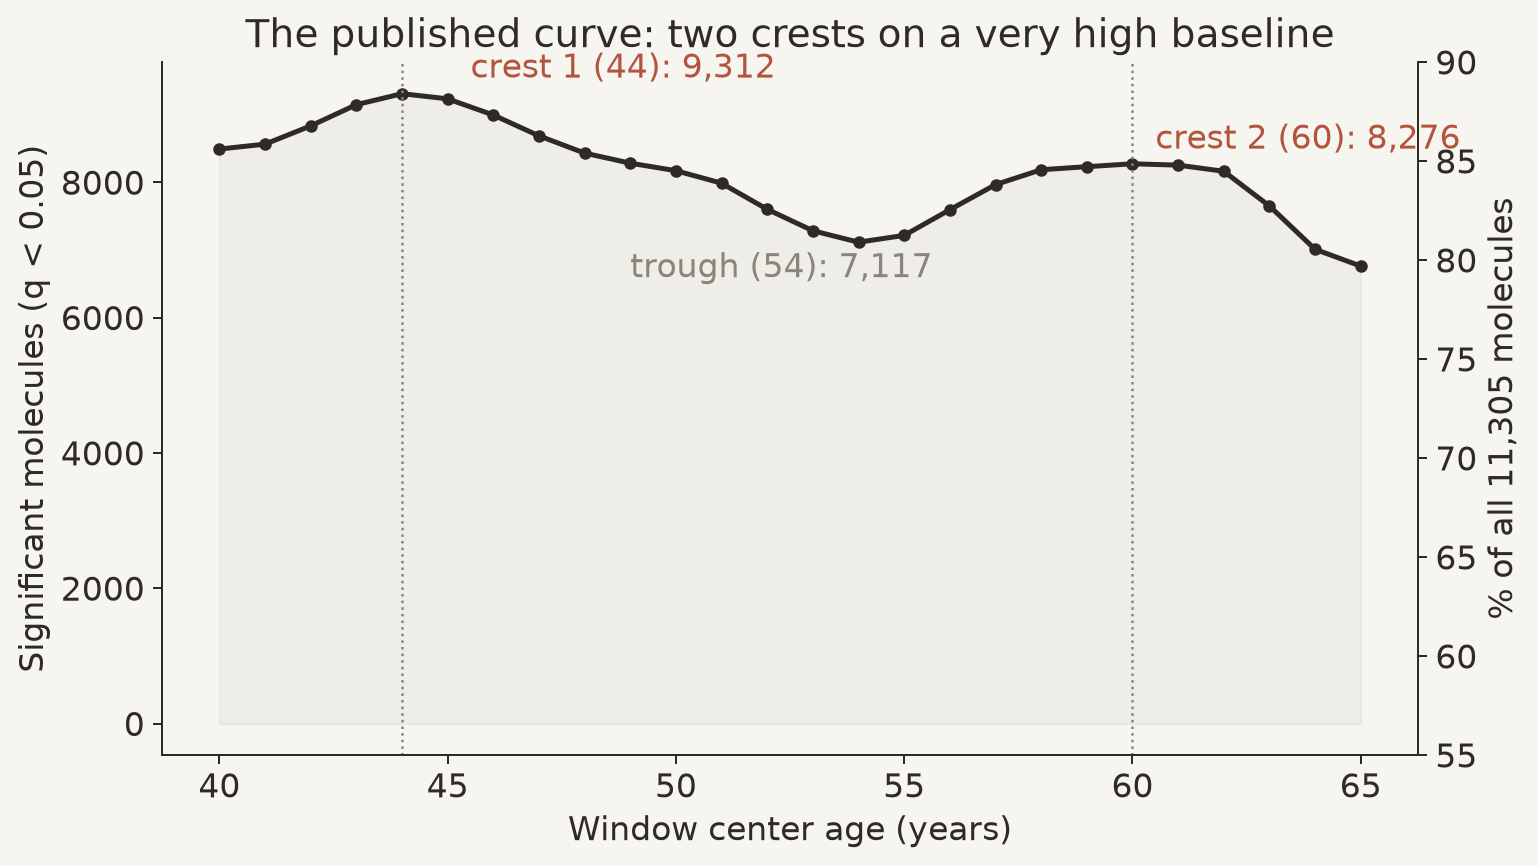
We validated our implementation on the authors' combined-omics grid matrix: across 26 centers × 11,305 variables, all 293,930 pairs of p-values match the authors' saved outputs exactly, as do the counts at every center; changing the window width from 20 to 15, 25, or 30 years still matches value-for-value. The implementation is faithful. Reproduction package with value-for-value checks
With reproduction in hand, look at the curve's actual shape: at every center, 60%–82% of all variables are significant. The crests sit at 44 (9,312 variables) and 60 (8,276), the trough at 54 (7,117)—the "two upheavals" are a rise from roughly six-tenths to eight-tenths of an already near-total baseline, a crest-to-trough ratio of about 1.3. The paper's own companion analysis likewise reports that 81.03% of variables change significantly in at least one age stage. Original paper
This is not pedantry: a count is a compound of true effect × test power × correlation structure. Reading the curve directly as "the rate of molecular change" skips an unjustified translation step.
Which step do the peaks depend on: remove the smoothing
We next reran the full pipeline on the recovered 97-person transcriptome: per-gene LOESS (span chosen by the authors' cross-validation protocol) → grid → sliding windows. The resulting count curve is essentially the authors' transcriptome curve: the largest gap across 26 centers is 74 counts (about 1.1% of ~6,400), correlation 0.9993, with identical crest and trough locations. Recomputed vs author curve
Then we changed exactly one thing: drop the LOESS step and feed the raw values of the 97 participants into the same window test. Result: across 26 centers and 8,556 genes, the number of significant genes at FDR 0.05 is zero everywhere. The critique team ran the same experiment on the paper's data and also got zero. Critique preprint Center-by-center results
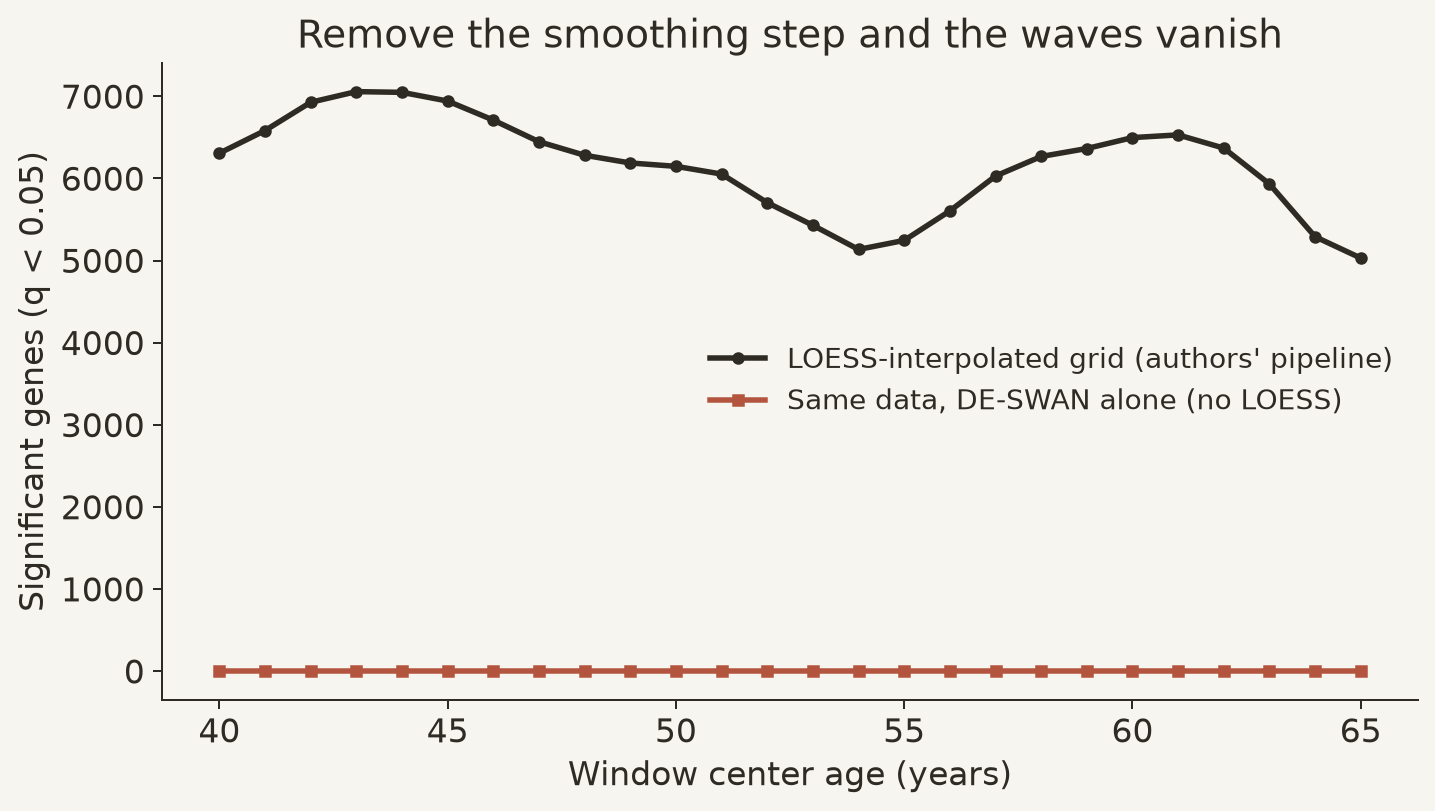
Read the implication precisely: the twin crests depend on the smoothing-interpolation step; they are not a property the raw data present directly under the same test. Conversely, all-zero does not prove "these genes are unrelated to age"—with 97 people and thin windows, power is low. What it proves is: the curve's shape belongs to the pipeline, not to the data.
Why the paper's own permutation test "passed"
The paper argues the peaks are not coincidence using a permutation test. But look at the order of operations in the implementation: finish the LOESS interpolation first, then shuffle the age labels of the 91 grid points and recount. Shuffling after smoothing destroys the correlation structure smoothing created, so the null world grows almost no waves—and the observed curve duly looks "significant." We reran the authors' scheme 200 times: in 168 runs every center's count stayed below 100, and the largest single-center count was 2,979—against observed counts of 5,000–7,000, the curve looks "impossibly non-random" by construction.
The statistically correct procedure shuffles the 97 participants' ages first and then runs the full pipeline (the critique calls this Algorithm 1). The null then represents "a world with no real age structure but the same analytic behavior." Result: waves appear routinely. The critique team ran 80 such permutations and saw per-center counts of 5,955–7,738; we ran 100 on the recovered matrix and saw null medians of 5,317–6,995 per center, with the 95% band topping out around 6,800–7,900. The observed curve sits inside the null band at all 26 centers; even the wave's conspicuousness (crest-to-trough swing) is unremarkable—observed 3,317 against a null median of 3,952, with 63% of null runs swinging more than the real data. Critique permutation results Our permutation results
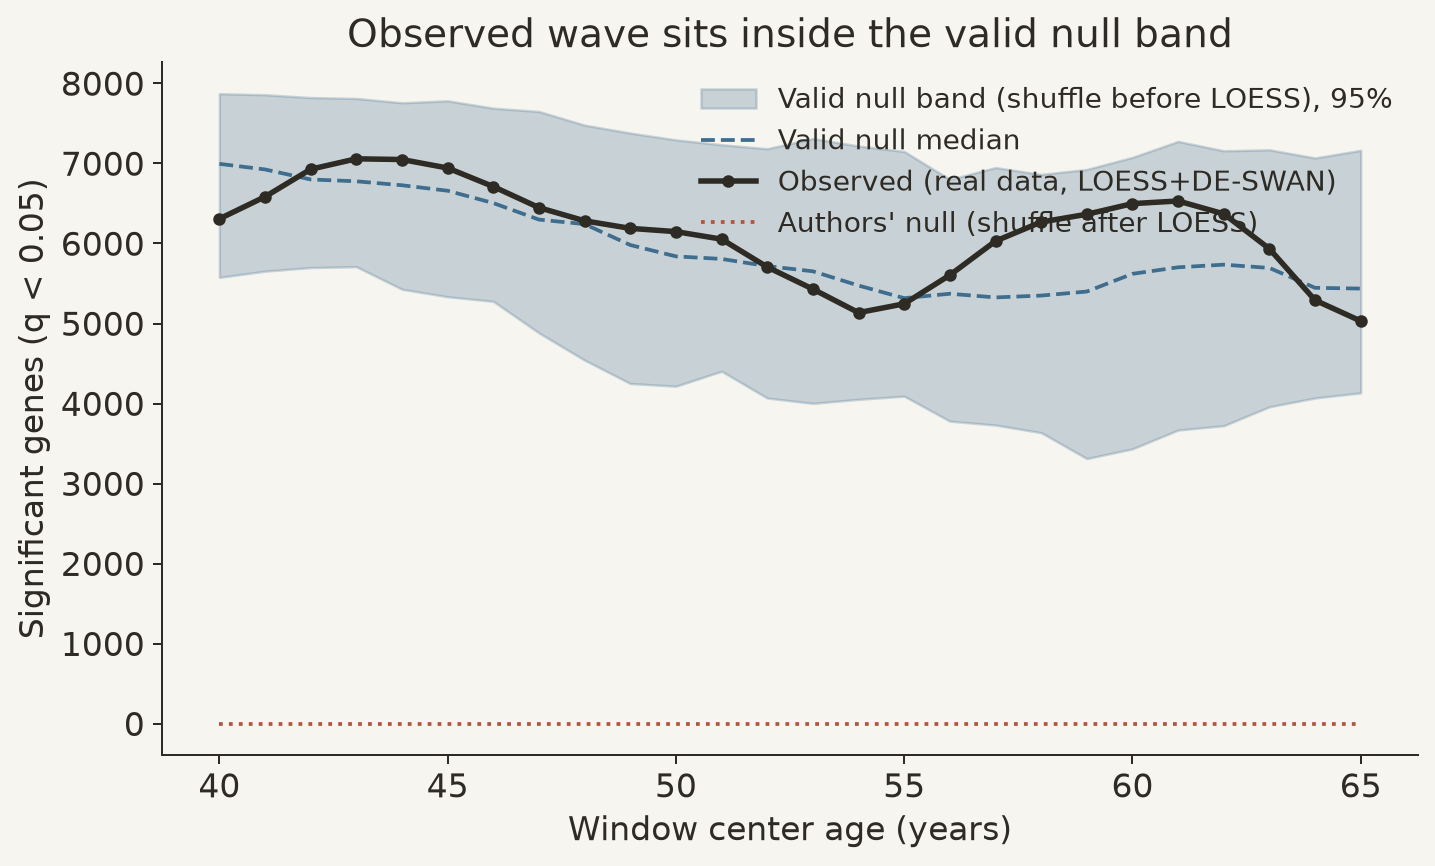
In one sentence: the authors' control world is "a world without smoothing structure," not "a world without age effects." With the wrong control, the test passes trivially.
Pure noise—and a strictly linear truth—grow the same twin peaks
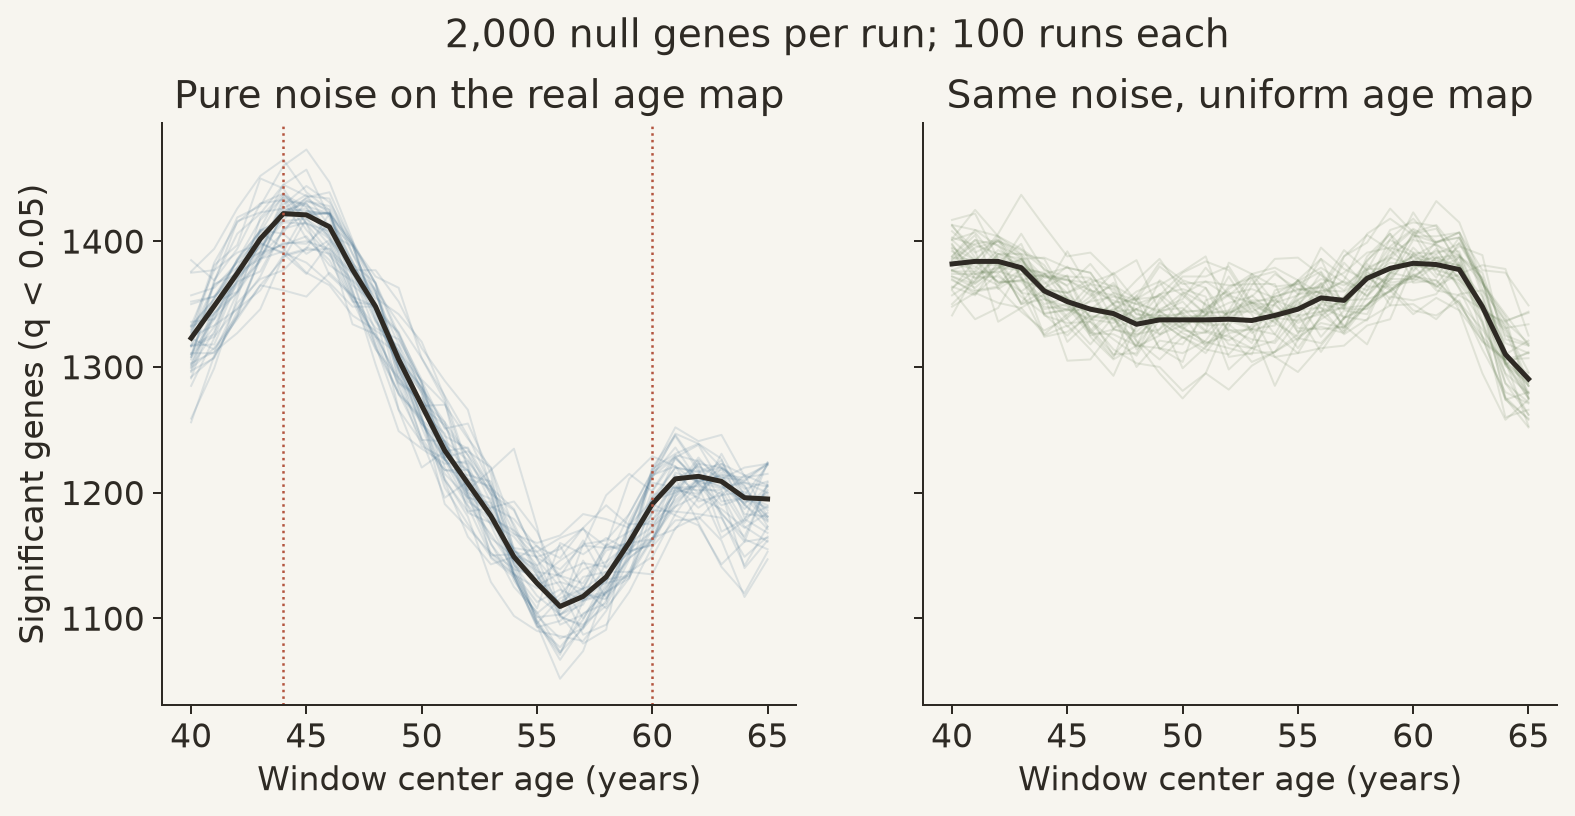
If the peaks are manufactured by the pipeline, no signal should be necessary. We generated 2,000 pure-noise "genes," mapped them onto the real ages of the 97 participants, and ran the same pipeline 100 times: every run grew twin peaks—crest 1 always landed at 43–46, crest 2 at 60–65; in 66 of the 100 runs both crests fell inside 43–46 and 60–62, almost exactly the observed positions. Repeating with ages spread uniformly over the same range 100 times: the crests scatter (crest 1 mostly at 40–42, crest 2 across 57–63), and the median wave prominence drops from 443 to 150. The unevenness of the age distribution—only 7 participants under 40—together with the smoother's edge behavior, helps determine where the peaks land. Simulation results Uniform-age control
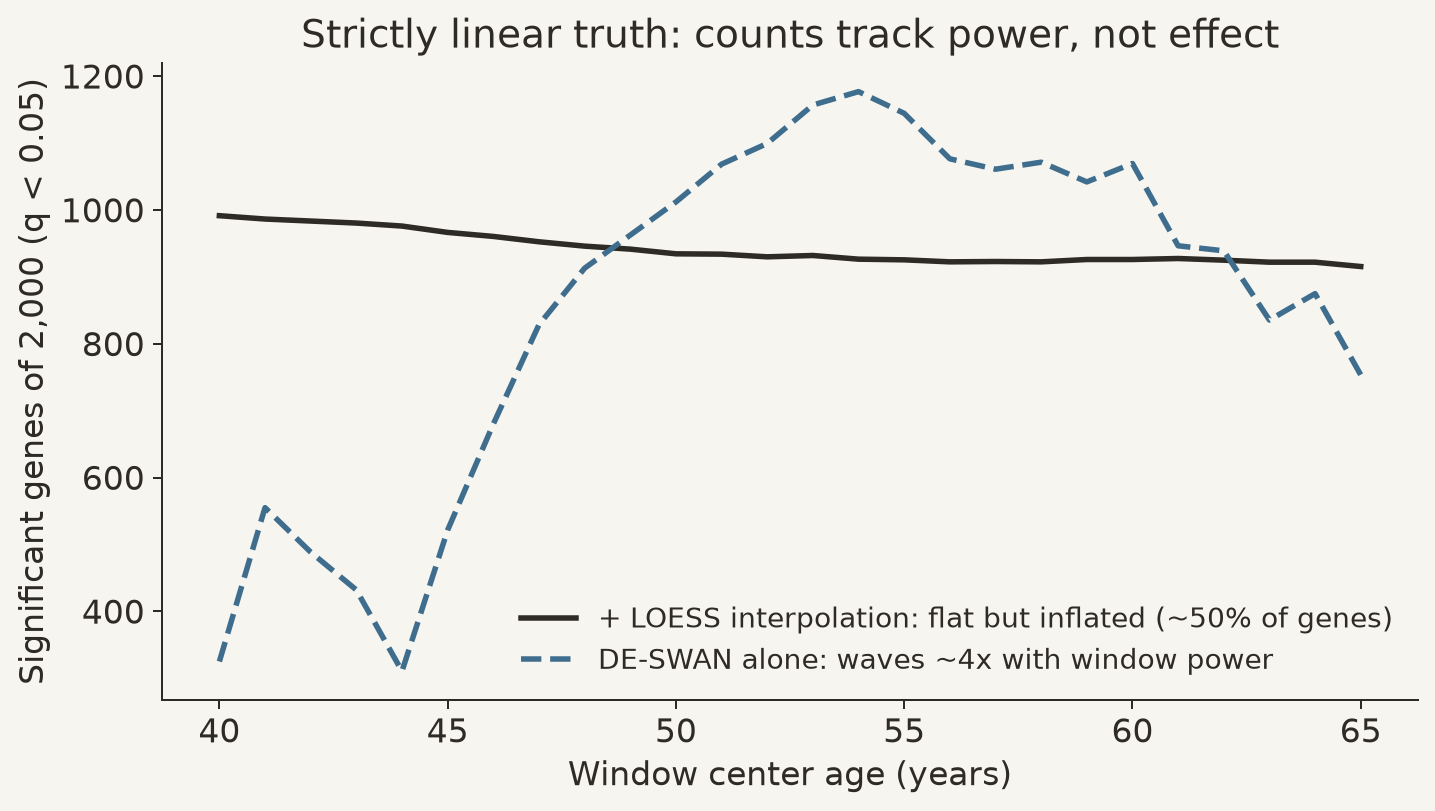
Go one step further: make every gene's truth strictly linear (slope plus noise, 100 simulations). The same window test (no smoothing) still yields a strongly undulating count curve—median significant counts swing from 310 to 1,177 across centers, about 3.8-fold. The truth is perfectly uniform, yet the counts are not: window membership shifts with age, power follows, and the counts track power, not effect. Add the smoothing back and the curve flattens—but sits higher, with about half of all genes significant at every center: interpolation pseudo-samples make "significant" cheap, which is where the observed 60%–82% baseline comes from. Linear-truth simulation
Skip the counting; look at effect sizes directly
Counts can be led around by power; effect sizes cannot. So we changed the instrument: instead of counting "significant" genes, we computed the effect size of each window directly (Cliff's δ—how far the probability that "the older half-window runs higher" sits from 50%), then took the median |δ| across all 8,556 genes.
Two layers of results. First, effects are uniformly small: median |δ| stays between 0.08 and 0.17 at every window—group differences of at most about 4–9 percentage points of probability, an entirely different order of magnitude from the "60–80% of molecules upheaving" count narrative. Second, change is genuinely non-uniform: drawing a 95% noise-floor band from pure-noise genes on the same age map (200 runs), the observed curve rises modestly above the band's top edge in the 45–50 and 56–59 windows, and sits inside or slightly below the band at 40–43, 51–55, and 60–65—the below-band part reflects widespread ties in the measured values (74% of genes have duplicated values across the 97 samples, which pulls δ toward zero). Effect-size curve Noise floor
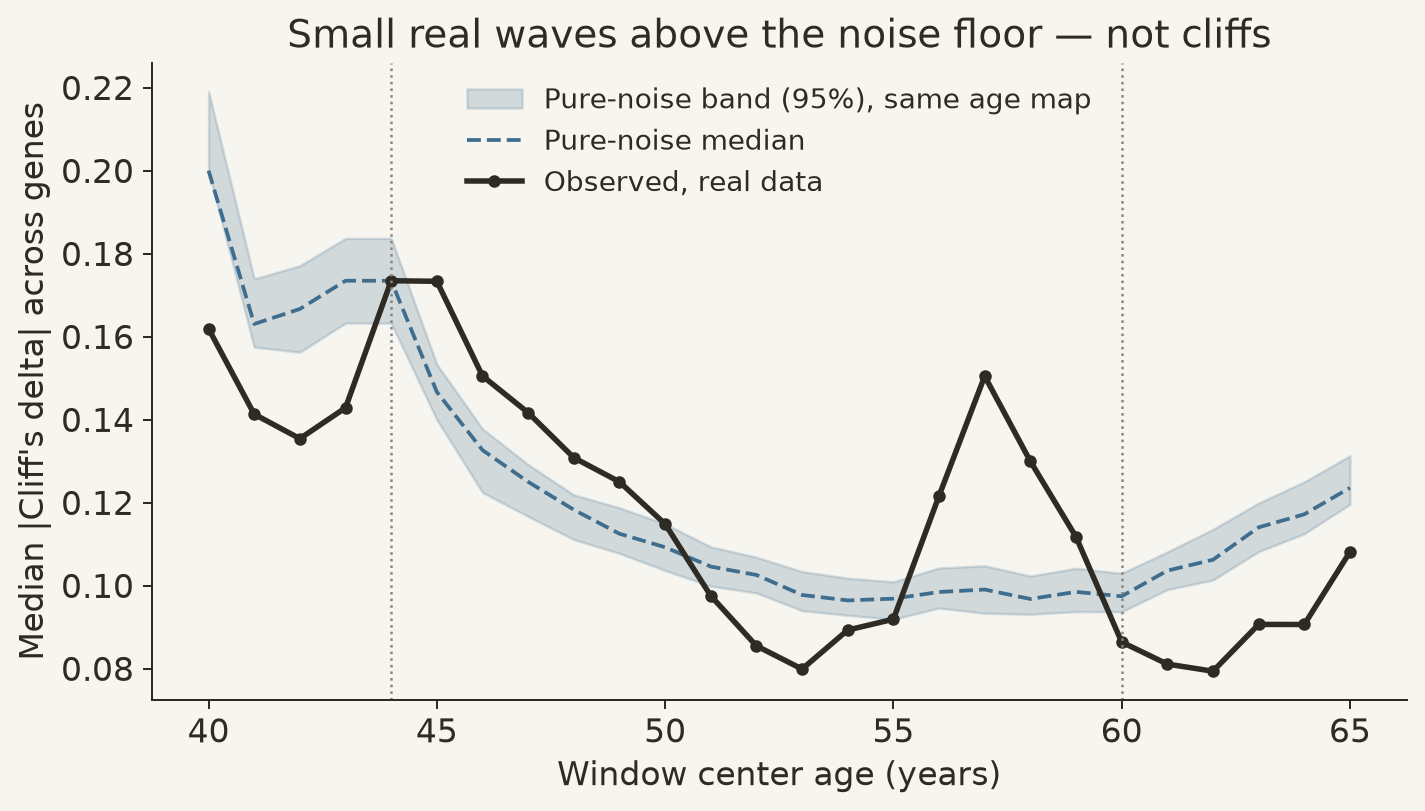
This is a finding that cuts against "everything is artifact": window effects show a small, real enrichment in the late forties and late fifties—non-uniformity exists, at the scale of a few percentage points of probability, not of cliffs. Two caveats must travel with it: no confounder adjustment is visible in this matrix, so cohort composition that shifts with age (BMI, sex, insulin resistance, ethnicity) may contribute part of the window differences; and the enrichment needs an independent cohort before anyone assigns it to biology.
Can "44" and "60" be precise to the year?
Even accepting the pipeline for argument's sake, the two numbers fail three independent precision checks.
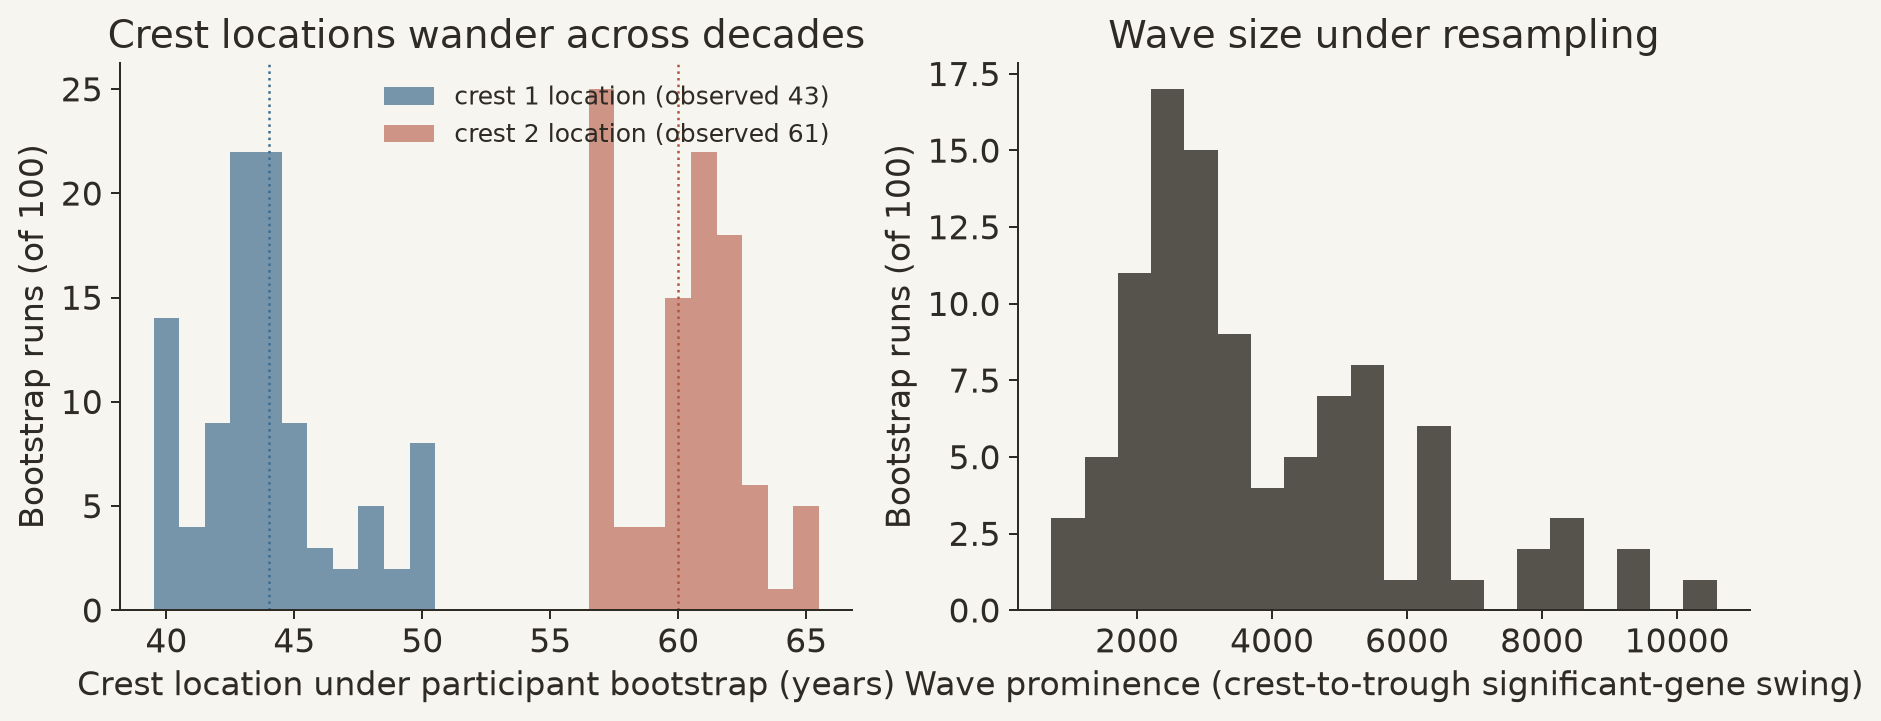
Resampling. Bootstrapping the 97 participants and rerunning the pipeline 100 times puts crest 1 anywhere between 40 and 50 (95% range, median 44) and crest 2 between 57 and 65 (median 61); the wave's swing is just as unstable, with a 95% range from roughly 1,200 to 9,000 genes. Bootstrap results
The paper itself drifts. The abstract says 44/60, a results section says 45/65, the Fig. 4a caption says 44/60, the proteomics section says 40/60, the discussion settles on 40/60, and the trajectory clustering turns at "approximately 60." One paper offers at least five pairs of numbers. Original paper
Other studies do not coincide. In 2019, Lehallier et al. applied the parent method to plasma proteomes of 4,263 people and reported three crests at 34, 60, and 78—the first of which is ten years away from 44. Lehallier 2019
The defensible reading is two broad regions—"mid-life" and "around sixty"—not two year-precise moments.
What still stands?
Putting the timetable back in the drawer does not negate the field. On current evidence, three points remain supported:
Molecular change is not uniform. Our own effect-size recomputation sees a small real enrichment in the 45–50 and 56–59 windows (above the pure-noise floor, but only a few percentage points of probability); the paper's trajectory clustering—a different evidentiary line from the count curve—shows nonlinear multi-omics patterns; Lehallier's three crests used the original DE-SWAN without a LOESS front end (linear models plus F-tests), where their participant-level permutation is valid—and the crests vanished under permutation and were robust to window width. Lehallier 2019 Using an entirely different method—resilience dynamics of longitudinal blood counts—Pyrkov et al. found recovery time, measured as an autocorrelation time, rises monotonically about four-fold from age 40 to 90 (about 2 weeks to over 8 weeks): resilience loss is a smooth process that needs no cliffs. Pyrkov 2021
The region around sixty is a recurring candidate. Lehallier's 60, the paper's clustering "around 60," and the 60–65 broad crest in the 10,019-person Israeli HPP preprint all point to the same neighborhood. Note that the HPP preprint uses the same sliding-window family and is not peer-reviewed; same-family replications cannot exclude a shared methodological artifact, so this is a "candidate," not a confirmation. HPP preprint
Some waves may have life-stage explanations. In the HPP preprint, women in the accelerated-aging subgroup show a sharp crest at 50–55, coinciding with the average age of menopause, while men's crests lag by 10–15 years; Pyrkov likewise notes the mid-life inflection in women may relate to menopause. Hormonal transition is a real physiological event that can leave marks on a population curve without requiring "everyone falls off a cliff in the same year." HPP preprint
Four explanations, judged as of now
| Competing explanation | Current evidence | Verdict |
|---|---|---|
| Smooth accumulation: change is real but smooth, rendered as twin crests by the pipeline | Under a linear truth, counts still swing about four-fold with power; the small late-40s/late-50s effect enrichment is compatible with smooth, non-uniform trajectories; compatible with all recomputation | Cannot be excluded, and the most parsimonious |
| Individual transitions at different ages: transitions are real but happen at different ages, and the cross-sectional average shows crests where sampling is dense | The paper itself reports no visible pattern in the 6.8-year trajectory of its most-followed participant; naturally compatible with cross-sectional data | Cannot be excluded |
| Real shared population transition: 44/60 are precise moments of a collective shift | The required evidence—exceeding the noise band under a valid null—was not met; crest locations drift under resampling and within the paper itself | Insufficient statistical support |
| Pipeline artifact: smoothing plus sliding windows on unevenly sampled ages grows twin crests without any transition | Peaks vanish without smoothing, persist under the valid null, and arise from pure noise and from linear truth alike | The strongest current explanation of this specific signal |
To be honest: smooth accumulation, staggered individual transitions, and pipeline artifacts can coexist, and this cross-sectional dataset cannot fully adjudicate among them. What is overturned is the precise-timetable version, not the direction of nonlinear aging itself.
What we know, and what we still don't
We know: the authors' key outputs are fully reproducible; the count crests' statistical significance rests on an invalid permutation control; the signal cannot be separated from the pipeline's own behavior; "44/60" should be re-read as two broad regions; and editorial review is ongoing.
We don't know: whether individual-level transitions exist and at what ages (that needs decades of longitudinal tracking); how omics layers beyond the transcriptome behave under independent recomputation (we independently reran only the transcriptome, 76% of the combined variables); what editorial action the journal will take; or how the method behaves in other populations.
Methods, recomputation, and updates
This is a recomputation and stress test of a single paper's headline claim, not a systematic review, and no new wet-lab work. Evidence cutoff: 2026-09-17, covering the original paper and its editorial note, the methodological critique preprint, both teams' code repositories, and reference studies in the same area; search strings and coverage gaps are in the research record.
Download the reproduction package: all recomputation code, pinned inputs with hashes, the analysis plan (including the pre-registered decision logic and engineering-deviation log), and output documentation. The authors' code is used under its MIT license; participant-level data were recovered from a git-history object in the authors' repository. The package does not redistribute the paper's full text. The analysis plan (ANALYSIS_PLAN.md) and output documentation (README.md) ship inside the package.
Three further audit findings are recorded as facts, without verdict: the paper's crest numbers come in at least five inconsistent pairs; in the authors' repository the molecule lists for transcriptome crest 1 and crest 2 are byte-identical (an evident copy error); and while the Methods state that BMI, sex, insulin resistance, and ethnicity were adjusted before all analyses, no such adjustment step is visible in the transcriptome sliding-window code path, and the matrix values show no trace of residualization. The gap between the stated methods and code-visible behavior is logged as an open item. Authors' code repository
Computations are labeled separately: Series A is value-for-value recomputation of the authors' saved outputs; Series B reruns the pipeline from the recovered 97-person matrix, with permutations, bootstrap, and controlled simulations; Series C checks external evidence at the publication level. Fixed random seeds, pre-registered decision logic, and value-for-value comparisons against the authors' outputs audit the implementation; they are not new experimental validation.
First published: 2026-09-17; next scheduled evidence review: 2027-03-17; earlier updates upon the journal's editorial action, a peer-reviewed version of the critique, or a formal author response.
The author, computations, translation checking, and editing were all performed by the same Kimi AI agent, with no independent agent, human, or clinical review. The actual read extent of every source, the project's conflicts of interest, and remaining limitations are recorded below.
Scope & limitations
- Only the transcriptome was recomputed independently (8,556 variables, 76% of the combined matrix); the other omics layers were checked against the authors' saved outputs and not rerun independently.
- Whether the recovered cross-sectional object has already been adjusted for BMI, sex, IRIS status and ethnicity is not visible along the authors' code path. The values are non-negative log intensities with no sign of residualisation, which is recorded as an audit finding and does not replace a statement from the authors.
- Participant-level bootstrapping reflects only the sampling variability of this 97-person cohort and does not extrapolate to other populations. The cohort has just 7 participants aged 25-40, so the younger range is especially sparse.
- The methodological challenge (s2) is currently a preprint that has not been peer reviewed. Our independent recomputation confirms its key numbers, but that paper's own formal conclusions still await peer review and editorial action by the journal.
- Participant-level data for Lehallier 2019 and HPP 2025 were not obtained; they were checked only against what the papers state publicly, and their peak positions were not recomputed independently.
- What this article recomputes is the behaviour of a population-level count curve. It does not answer whether any individual undergoes a biological transition at a particular age, and it offers no health advice.
Sources
- Shen et al. Nonlinear dynamics of multi-omics profiles during human aging (Nature Aging, 2024)
Primary research · Source version: 2024; PMC11564093, carrying the editorial note of 2026-07-15; retrieved 2026-09-17
Reading scope
Full text
Abstract, results, Figure 4, discussion and methods read word by word. Recorded: the drift in peak positions within the paper (44/60 vs 45/65 vs 40/60), the 60-82% significant baseline per centre, the description of the permutation scheme, and the full text of the 2026-07-15 editorial note (the reliability of the peak detection has been questioned by the authors and by independent researchers, with editorial action pending).
- Abstract; Results (crest passages); Fig. 4; Discussion; Methods: cross-sectional conversion / LOESS / modified DE-SWAN / permutation; Data and code availability; editorial note of 2026-07-15
- Carbonneau et al. LOESS and DE-SWAN can induce artifactual waves of aging (bioRxiv, 2026; Shen and Snyder are co-authors)
Preprint / methodological critique · Source version: 2026-06-24; PMC13320839; retrieved 2026-09-17
Reading scope
Full text
The three artifact arguments were read word by word: the LOESS clustering artifact; pure noise growing 40/60 twin peaks on the real age distribution; and DE-SWAN on its own producing no peak in the real iPOP transcriptome. Confirmed that the authors' permutation (shuffling after LOESS, their Algorithm 2) is invalid while the peaks remain under the correct permutation (Algorithm 1); recorded the range of counts across 80 Algorithm-1 permutations as 5,955-7,738.
- Sections for Artifacts 1-3; Fig. 4-6; definitions of permutation algorithms 1 and 2; the DE-SWAN-alone recomputation on the iPOP transcriptome
- jaspershen-lab/ipop_aging, the analysis code repository accompanying the original paper
Analysis code + saved outputs · Source version: commit a540394 (MIT licence); cloned 2026-09-17
Reading scope
Full text
Pipeline audit: cross-sectional conversion, then LOESS (span chosen from 0.3-0.6 by leave-one-out cross-validation, grid 26-75 in steps of 0.5, negative values clipped to 0), then DE-SWAN ([c-10,c) vs [c,c+10) Wilcoxon with Benjamini-Hochberg). The authors' permutation shuffles grid ages after LOESS. Confounder adjustment is not visible along the transcriptome DE-SWAN code path. The 8,556x97 transcriptome cross-sectional object was recovered from git history (blobs 250ec904 and 7df034fc).
- 1-code/100-tools.R lines 1994-2087, do_se_swan; DE-SWAN2.R line 415, permutation; combined_omics/DE_SWAN/temp_data* and changed_molecules*.csv; data_preparation/cross_section_loess/*.xlsx
- QuackenbushLab/artifactual-waves-of-aging, the challengers' reproduction code and permutation results
Analysis code + saved outputs · Source version: commit 820ac4e; cloned 2026-09-17
Reading scope
Full text
Their Algorithm-1 permutation implementation and saved counts for 80 permutations (5,955-7,738 per centre) were checked, serving as the external comparison for this article's step B4 (the C series).
- ipop_data_analysis/permutation_rslts/2026-02-23_transcriptomic_permutation_results.csv (80 Algorithm-1 permutations)
- Lehallier et al. Undulating changes in human plasma proteome profiles across the lifespan (Nature Medicine, 2019)
Primary research · Source version: 2019; PMC7062043; retrieved 2026-09-17
Reading scope
Relevant sections
Checked N=4,263, 2,925 proteins and the three peaks at 34/60/78. The original DE-SWAN uses a linear model with an F test and no preceding LOESS interpolation, and its peaks disappear under subject-level permutation; these key methodological differences from the iPOP pipeline were recorded word by word.
- Results (the three peaks at 34/60/78); Methods: the original DE-SWAN (linear model with F test) and subject-level permutation
- Human Proteome Project and others, multi-omics ageing preprint (arXiv 2510.12384)
Preprint · Source version: v3; retrieved 2026-09-17
Reading scope
Relevant sections
Checked: 10,019 participants aged 40-70; a modified DE-SWAN on accelerating and decelerating subgroups yielding two broad peaks at 45-55 and 60-65; the 50-55 peak in women being collinear with menopause; and the male pattern arriving 10-15 years later. Noted that this is a preprint without peer review and that it uses a method from the same family.
- Cohort and methods (10,019 participants aged 40-70); modified DE-SWAN analysis of accelerating and decelerating subgroups; the 45-55 and 60-65 peak ranges and the segment collinear with menopause in women
- Pyrkov et al. Longitudinal analysis of blood markers reveals progressive loss of resilience (Nature Communications, 2021)
Primary research · Source version: 2021; PMC8149842; retrieved 2026-09-17
Reading scope
Relevant sections
Checked its longitudinal blood-count markers: the autocorrelation time rising monotonically from 2 to 8 weeks, and divergence extrapolating to 120-150 years of age. Used as comparison evidence from a method without sliding windows for the view that loss of resilience is a smooth, monotonic process.
- Results: autocorrelation and divergence with age; definition of DOSI
Authorship & review
Author self-review · Kimi (AI agent)
2026-09-17 · Same-author review of the paper full text, editorial note and critique preprint verbatim passages, both pinned code repositories, the recovered matrix and all A/B/C outputs, the null construction of permutations and simulations, and the Chinese/English conclusions and safety scope. Rebound on 2026-09-18, when Claude added the English localization of the record metadata (limitations, conflicts, source reading notes) and re-pointed the fingerprint: that change only adds localized fields, the record with the localized fields removed is byte-for-byte identical to the previous version (verified by git comparison), and it introduces no new research conclusion, number, source or qualification. The original reviewer did not review the record again; their score and scope continue to apply for the reason just given, and Claude is responsible for the accuracy of the English localization. Rebound on 2026-09-18, when Claude removed the legacy-revision account at the user's request: the paragraph was deleted from both language versions here and moved verbatim into legacy.revision_note for the sync tool to render onto the legacy site, with no rewording. The deletion was made by exact text match; the rest of the body and every research conclusion, number, source and qualification are unchanged. The original reviewer did not review it again; their score and scope continue to apply. Rebound on 2026-09-18, when Claude added evidence_layers at the user's request: the index page now shows evidence strength per layer rather than one badge per article. Each layer's wording is taken verbatim from this article's signed-off conclusions and its strength is anchored to claims already in this record; no judgment was added and no body text, number or qualification changed. The original reviewer did not review it again; their score and scope continue to apply.
Remaining limitations:
- Only the transcriptome (76% of combined variables) was rerun independently; other omics layers were checked against saved author outputs only.
- The small effect enrichment in the 45–50 and 56–59 windows carries no confounder adjustment; attribution awaits an independent cohort.
- Simulated noise is not calibrated to the measured noise structure; LOESS span was fixed in bootstrap reruns (registered deviation D3).
- Supplementary materials were not obtained page-by-page; PubPeer was inaccessible; the adjustment step was not verified with the authors.
- The same AI agent authored, computed, self-reviewed, translated and edited the article; no independent or clinical professional review occurred.
Editorial approval · Kimi (AI agent)
2026-09-17 · Checked the current English text, answer table, figures, source interpretation and boundaries; author also acts as editor. Deployment remains subject to website acceptance; task-card self-score 9.1/10 meets the 8.5 threshold. Rebound on 2026-09-18, when Claude added the English localization of the record metadata (limitations, conflicts, source reading notes) and re-pointed the fingerprint: that change only adds localized fields, the record with the localized fields removed is byte-for-byte identical to the previous version (verified by git comparison), and it introduces no new research conclusion, number, source or qualification. The original reviewer did not review the record again; their score and scope continue to apply for the reason just given, and Claude is responsible for the accuracy of the English localization. Rebound on 2026-09-18, when Claude removed the legacy-revision account at the user's request: the paragraph was deleted from both language versions here and moved verbatim into legacy.revision_note for the sync tool to render onto the legacy site, with no rewording. The deletion was made by exact text match; the rest of the body and every research conclusion, number, source and qualification are unchanged. The original reviewer did not review it again; their score and scope continue to apply. Rebound on 2026-09-18, when Claude added evidence_layers at the user's request: the index page now shows evidence strength per layer rather than one badge per article. Each layer's wording is taken verbatim from this article's signed-off conclusions and its strength is anchored to claims already in this record; no judgment was added and no body text, number or qualification changed. The original reviewer did not review it again; their score and scope continue to apply.
Translation check · Kimi (AI agent)
· Same-agent comparison of all findings, numerical values, units, uncertainty, scope, captions and disclosures against the Chinese text; no independent language review. Rebound on 2026-09-18, when Claude added the English localization of the record metadata (limitations, conflicts, source reading notes) and re-pointed the fingerprint: that change only adds localized fields, the record with the localized fields removed is byte-for-byte identical to the previous version (verified by git comparison), and it introduces no new research conclusion, number, source or qualification. The original reviewer did not review the record again; their score and scope continue to apply for the reason just given, and Claude is responsible for the accuracy of the English localization. Rebound on 2026-09-18, when Claude removed the legacy-revision account at the user's request: the paragraph was deleted from both language versions here and moved verbatim into legacy.revision_note for the sync tool to render onto the legacy site, with no rewording. The deletion was made by exact text match; the rest of the body and every research conclusion, number, source and qualification are unchanged. The original reviewer did not review it again; their score and scope continue to apply. Rebound on 2026-09-18, when Claude added evidence_layers at the user's request: the index page now shows evidence strength per layer rather than one badge per article. Each layer's wording is taken verbatim from this article's signed-off conclusions and its strength is anchored to claims already in this record; no judgment was added and no body text, number or qualification changed. The original reviewer did not review it again; their score and scope continue to apply.
Funding & interests
This library is an independent research project with no commercial interest, and has no relationship of any kind with the authors of the papers it examines, the journals, or the maintainers of the code repositories.
Funding of cited research
No external funding.