Our assessment is that evidence linking autophagy to aging is scientifically useful, but an increase in an autophagy marker, more completed clearance, and resulting improvements in health or lifespan each require their own evidence. We reanalyzed individual-animal data from a key mouse study, constructed models of formation, blockade and degradation, and examined human measurement studies available through 21 September 2026. The results preserve a reproducible mouse lifespan finding while showing why some common readouts cannot independently establish how much faster clearance has become.
Autophagy is a process with several stages
This article mainly concerns macroautophagy. Cells enclose intracellular material in autophagosomes, which fuse with lysosomes to form autolysosomes. An acidic environment and enzymes then support breakdown and recycling. Nutrient sensing, vesicle formation, transport, fusion, acidification and substrate degradation can each influence the outcome. Assay guidelines
LC3 is a widely used marker. Its lipidated form, LC3-II, is associated with autophagy-related membranes; fluorescent LC3 puncta help locate these structures. A punctum is neither the weight of cellular waste nor a unit of cargo already processed. The guidelines distinguish carrier flux from cargo flux: movement of LC3 through the pathway does not guarantee that a harmful protein or damaged mitochondrion is cleared in the same proportion. Source 1
Likewise, increased expression of an autophagy gene, more LC3-II, or less of the autophagy substrate p62 is insufficient on its own. p62 also responds to changes in synthesis, while LC3 readouts depend on processing and reporter behavior. Complementary experiments are needed to distinguish the stages.
The same count can conceal different rates
In a minimal model, let A denote the number of visible autophagy-related structures, f their formation rate, and k the rate constant for each structure to leave this visible pool:
dA/dt = f − kA
With constant parameters at steady state, A = f/k. A single measurement of A therefore cannot determine both f and k.
For an illustrative parameter set, formation of 10 structures per unit time and a removal rate constant of 1 produce a steady count of 10. Doubling both rates leaves the count at 10 while doubling throughput. Conversely, unchanged formation with slower removal increases the count.
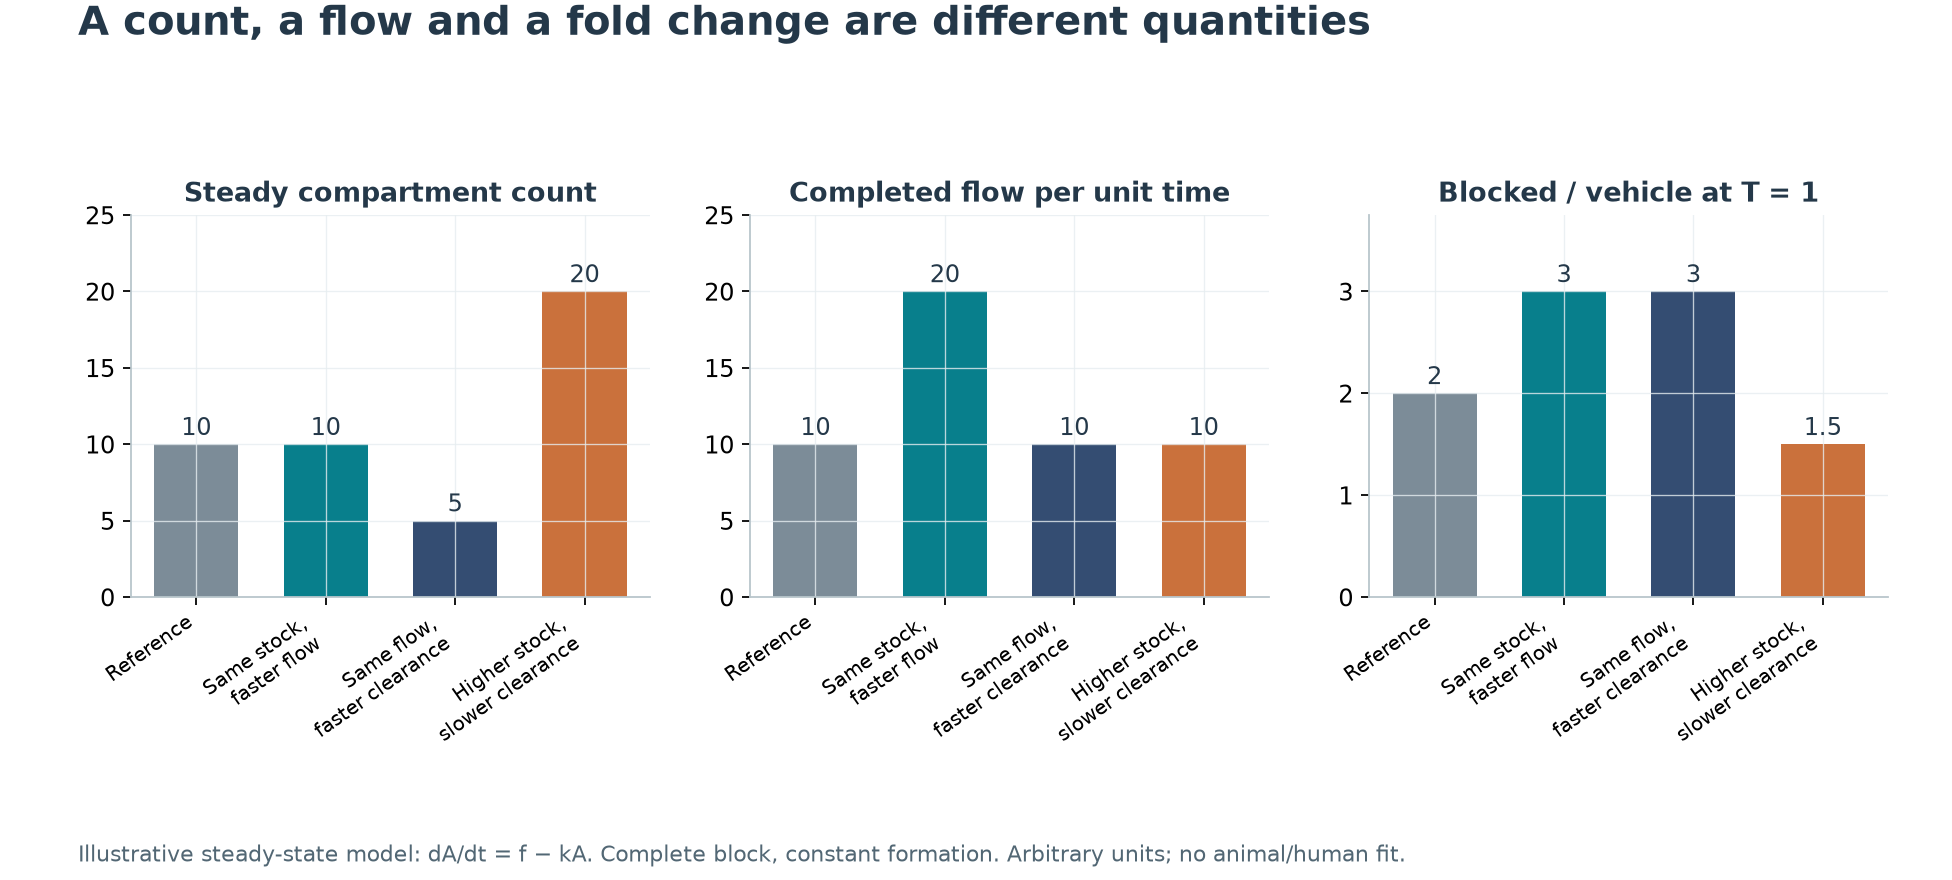
The model uses arbitrary time and count units; it is not fitted to human or mouse half-lives. It demonstrates non-uniqueness in measurement. Interpreting departure from the visible pool as complete degradation of harmful cargo requires further evidence.
A blockade adds information, but differences and ratios still differ
A common approach compares samples under otherwise comparable conditions: one runs normally, while the other undergoes a temporary block of lysosome-related processing. Accumulation under blockade provides information about material that would otherwise have passed through the pathway.
In the model above, if the starting state is steady, the block is complete, and formation is unchanged, after duration T:
- Blocked minus control:
ΔA = f × T, representing marker accumulation over the interval. - Blocked divided by control:
R = 1 + k × T, representing turnover relative to the pre-existing pool.
A larger ratio can therefore occur without an increase in absolute throughput. Keep f at 10 and increase k from 1 to 2: the starting pool falls from 10 to 5. With a complete block lasting T = 1, both accumulate 10 additional units, but their ratios are 2 and 3.
Ratios can be useful; the question is what they estimate. “Faster turnover relative to the starting pool” does not by itself mean “more waste cleared.”
What the source data show about turnover
In 2018, Fernández and colleagues studied a Becn1 knock-in model. The F121A mutation reduces the interaction of beclin 1 with the negative regulator BCL2, allowing investigators to examine basal autophagy and lifespan. This is a genetic alteration present from early life, not a short course of an autophagy-promoting drug in old animals. Original study and source data
We obtained the GFP-LC3 source tables and first averaged 2,071 field measurements within each mouse before making comparisons. This produced 101 animal–tissue means across seven tissue/age settings. It does not represent 101 globally distinct mice, and repeated labels such as “WT1” in different treatment groups were not treated as paired observations from one animal.
Two comparisons answer different questions:
| Comparison | Question it helps address |
|---|---|
| Chloroquine-treated minus vehicle-treated animals within a genotype | Is there residual turnover that blockade can reveal? |
| The difference between those increments across genotypes | Is the blockade-sensitive increment larger in the knock-in group? |
For example, in two-month-old skeletal muscle, mean puncta per 2,500 square micrometers increased from about 30.8 to 58.4 in wild-type animals and from 58.6 to 76.1 in knock-in animals. The knock-in group had both a higher starting value and a higher blocked endpoint, but the increments were 27.6 and 17.6, respectively. A higher endpoint does not establish a larger increment.
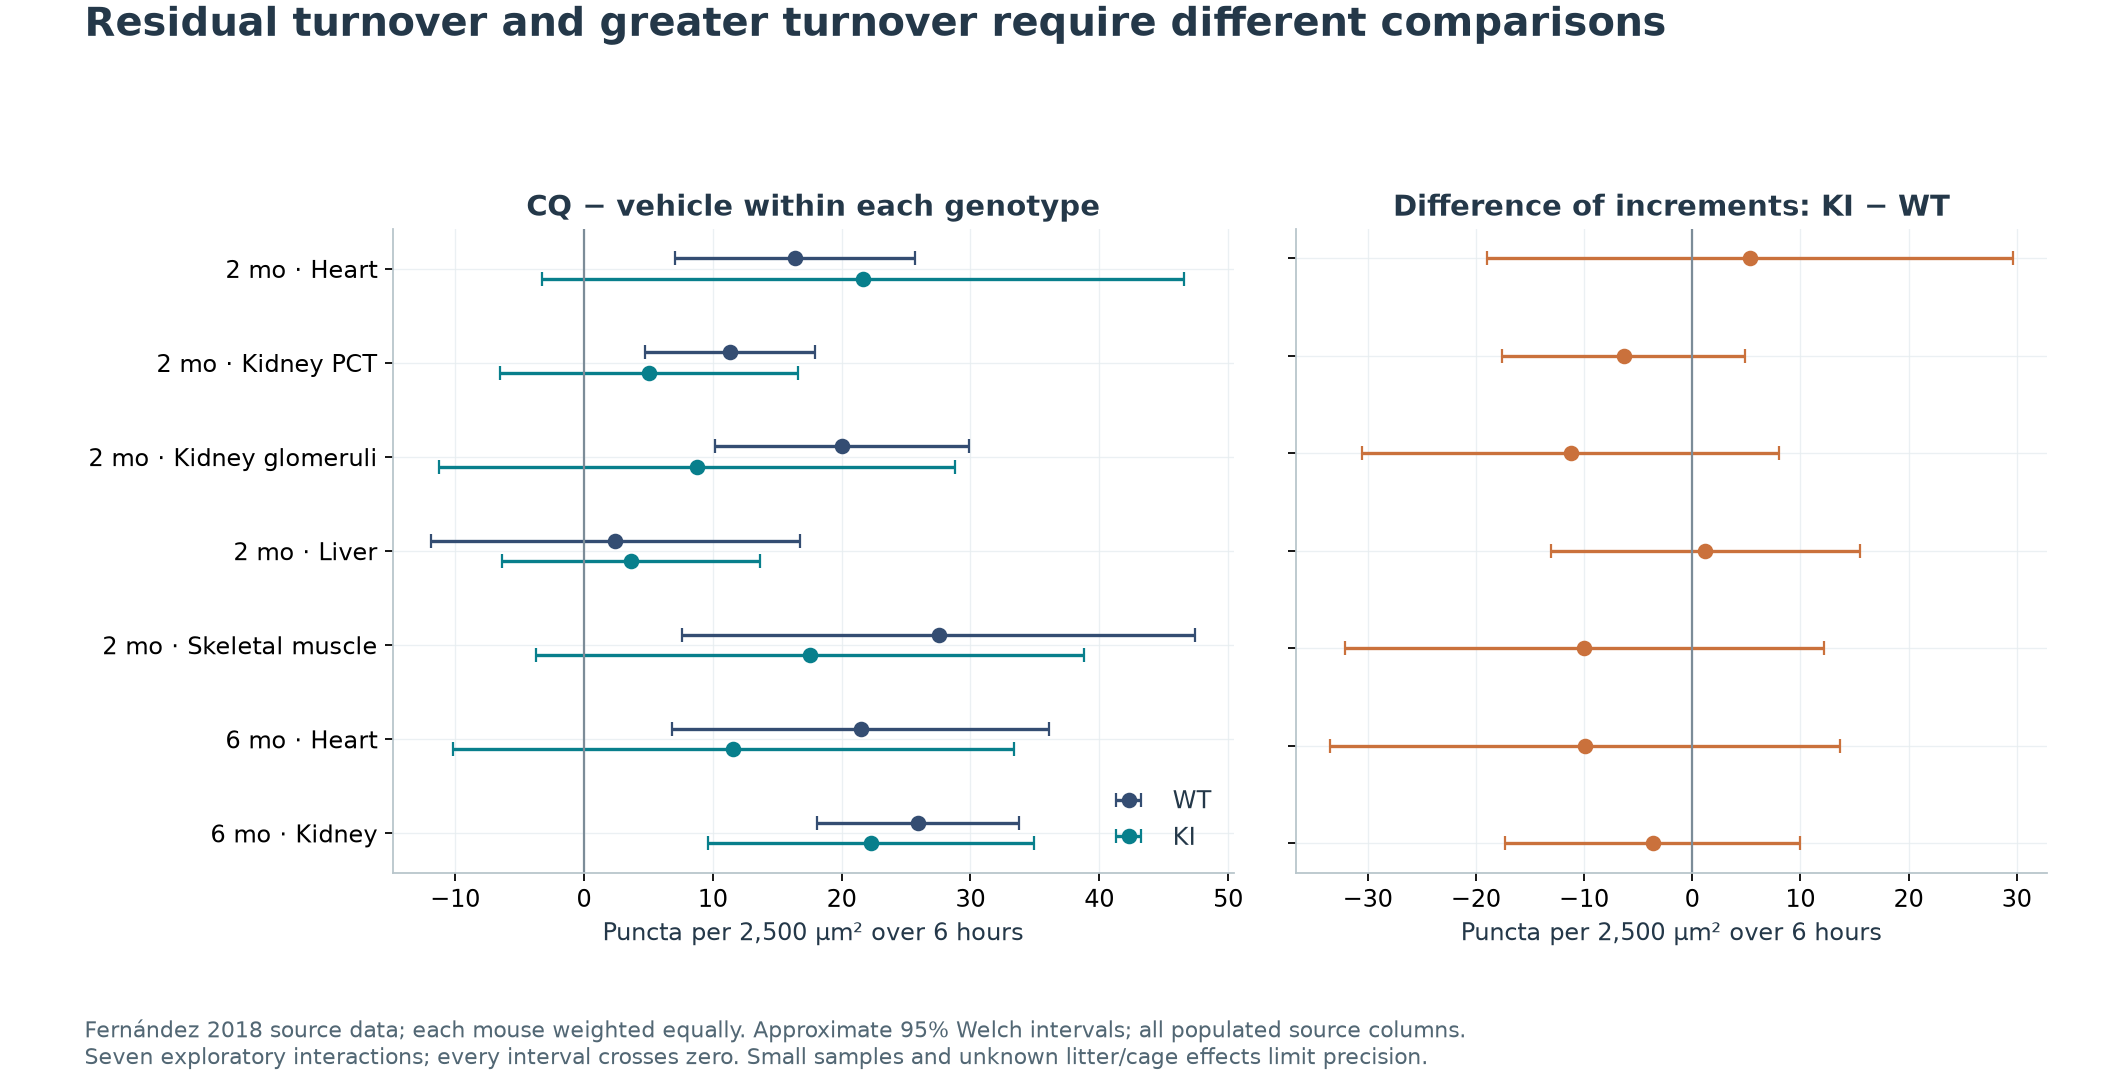
We used between-animal variability to calculate approximate 95% intervals. Every interval for the seven differences of increments crossed zero. The skeletal-muscle estimate was approximately −10.0, with an interval from −32.1 to 12.1; the two-month heart estimate was 5.3, with an interval from −19.0 to 29.6. Exploratory multiplicity adjustment did not change that interpretation.
These small puncta experiments do not precisely identify a larger genotype-specific increment. That does not establish equality or refute the entire mechanistic case for enhanced autophagy. The original study also used target-interaction assays, protein markers, cell blockade experiments and electron microscopy. Our conclusion concerns what this particular measurement can establish on its own.
There is also a source discrepancy to retain: captions and the reporting summary describe three mice per group, whereas some source-table groups contain four and the six-month experiments include five or six. We retained every populated animal column and performed leave-one-animal-out sensitivity analysis rather than guessing which animals were plotted. We did not resegment original images, and litter/cage information was insufficient to adjust for dependence. Source 2
What happens when blockade is incomplete or changes formation?
Real experiments may not satisfy the model's ideal conditions. Inhibitor exposure can vary across tissues and affect fusion, acidification or other processes. Longer exposure may alter cell state and vesicle formation. Even with an existing partial block, adding an inhibitor can produce further LC3 accumulation: an additional increase does not exclude a pre-existing clearance defect. Source 1
We separately varied residual clearance, formation during blockade and observation time. In the figure, 1.00× means that a rate inferred from the blocked-minus-control difference equals the original formation rate.
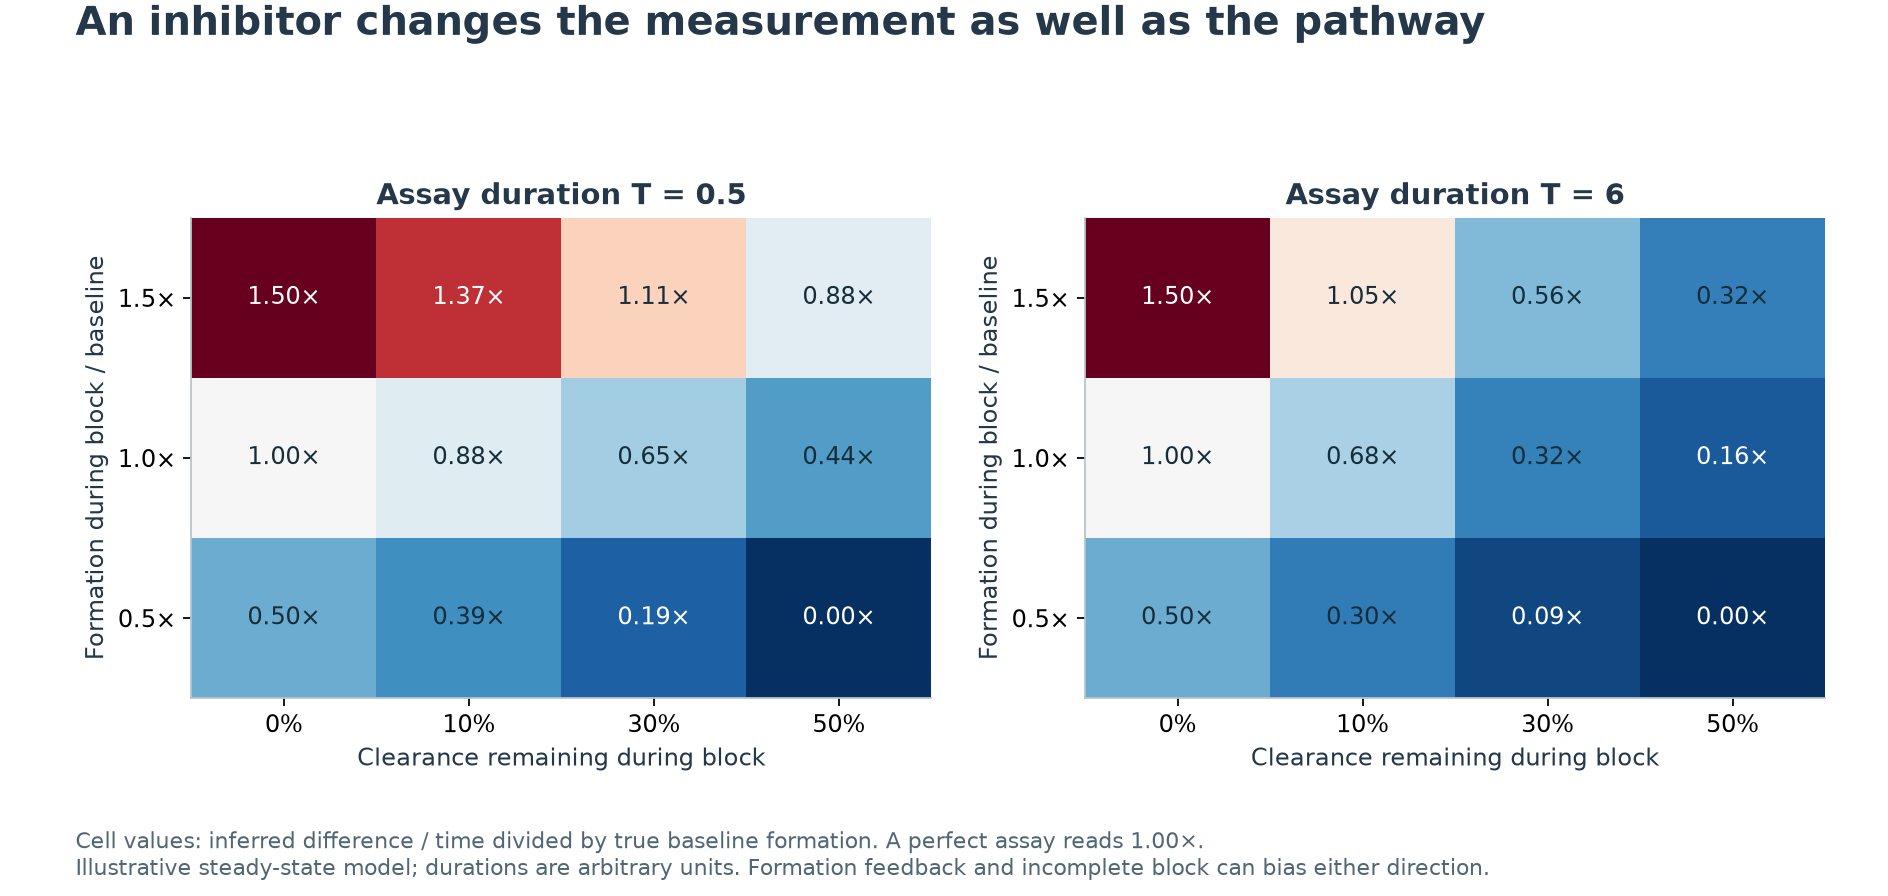
With a steady starting state and unchanged formation, retaining 30% of clearance yields only about 65% of the original formation rate after 0.5 model time units; after 6 units it yields about 32%. If blockade also stimulates formation, the readout can instead be too high.
These are conditional calculations, not correction factors for a participant or an experimental figure. They explain why inhibitor validation, multiple time points, suitable controls and complementary methods affect confidence in an interpretation. Sensitivity to a non-steady starting state is also included in the reproducibility materials.
More red vesicles do not necessarily mean more completed degradation
Tandem fluorescent reporters exploit different responses of GFP and red fluorescence to acidity, helping distinguish structures that have entered an acidic environment from those that have not. They provide information about delivery and maturation, but arrival in an acidic compartment is not completion of substrate breakdown. Red-reporter persistence can also affect the readout.
A 2025 study across mouse tissues used such a reporter. Age-related patterns differed between blood, heart and motor cortex, with sex and diet also influencing the results. The authors explicitly state that their ratio more closely reflects delivery of autophagosomes to lysosomes and is not strictly completed autophagic flux. Study and limitations
To examine one alternative explanation, we split the model into two pools: autophagosomes A and autolysosomes L, with fusion rate constant m and downstream degradation rate constant d:
dA/dt = f − mA; dL/dt = mA − dL
At steady state, A/L = d/m, while completed processing in compartment-equivalent units is dL = f. The ratio does not even contain the formation rate f.
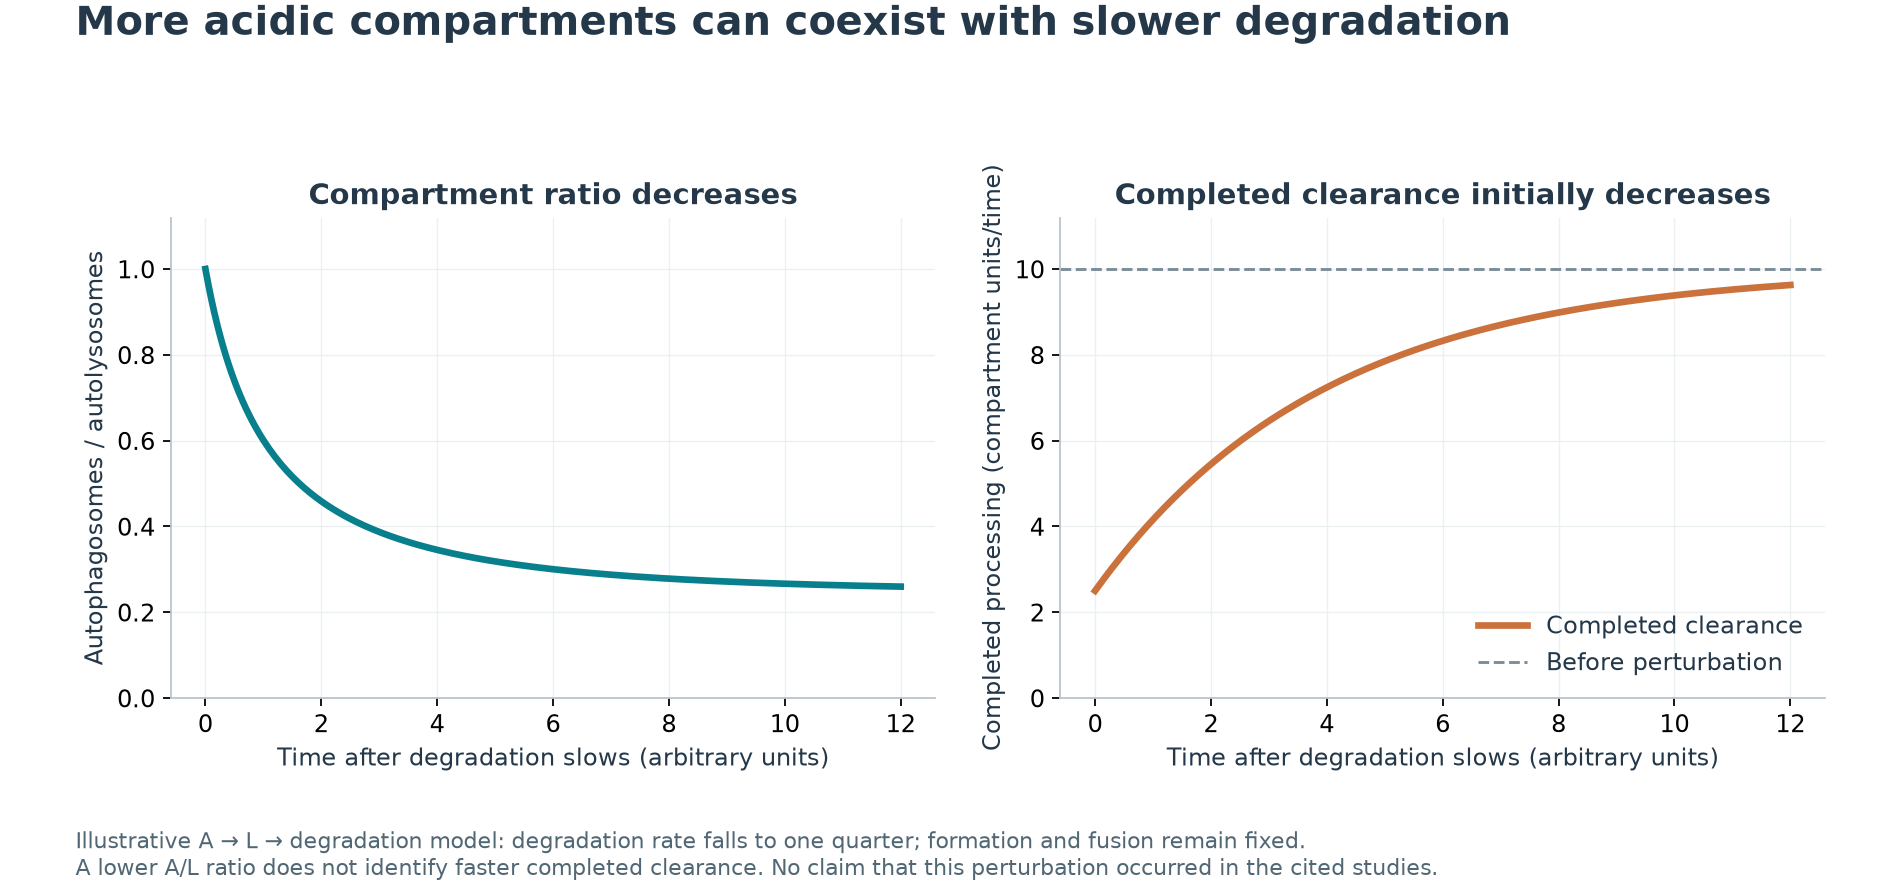
In an example with unchanged formation and fusion, reducing the degradation rate to one quarter causes L to accumulate and A/L to fall. Completed throughput initially drops to one quarter and then gradually recovers as the pool accumulates. Interpreting every decrease in A/L as faster clearance could therefore be misleading.
This establishes that different processes can produce a particular readout. It does not show that the 2025 study actually experienced this blockage, nor does it invalidate tandem fluorescence. A fuller assessment separates acidification, reporter stability and substrate degradation.
Mouse lifespan reproduces without closing every causal gap
The 2018 Becn1 survival table contains 170 mice: 68 wild-type and 102 knock-in animals. Every entry is recorded as a death, with time rounded to whole months. The female and male tables reconcile exactly with the combined table. Our reconstructed survival curves, medians and statistical tests agree with the published report. Source 2
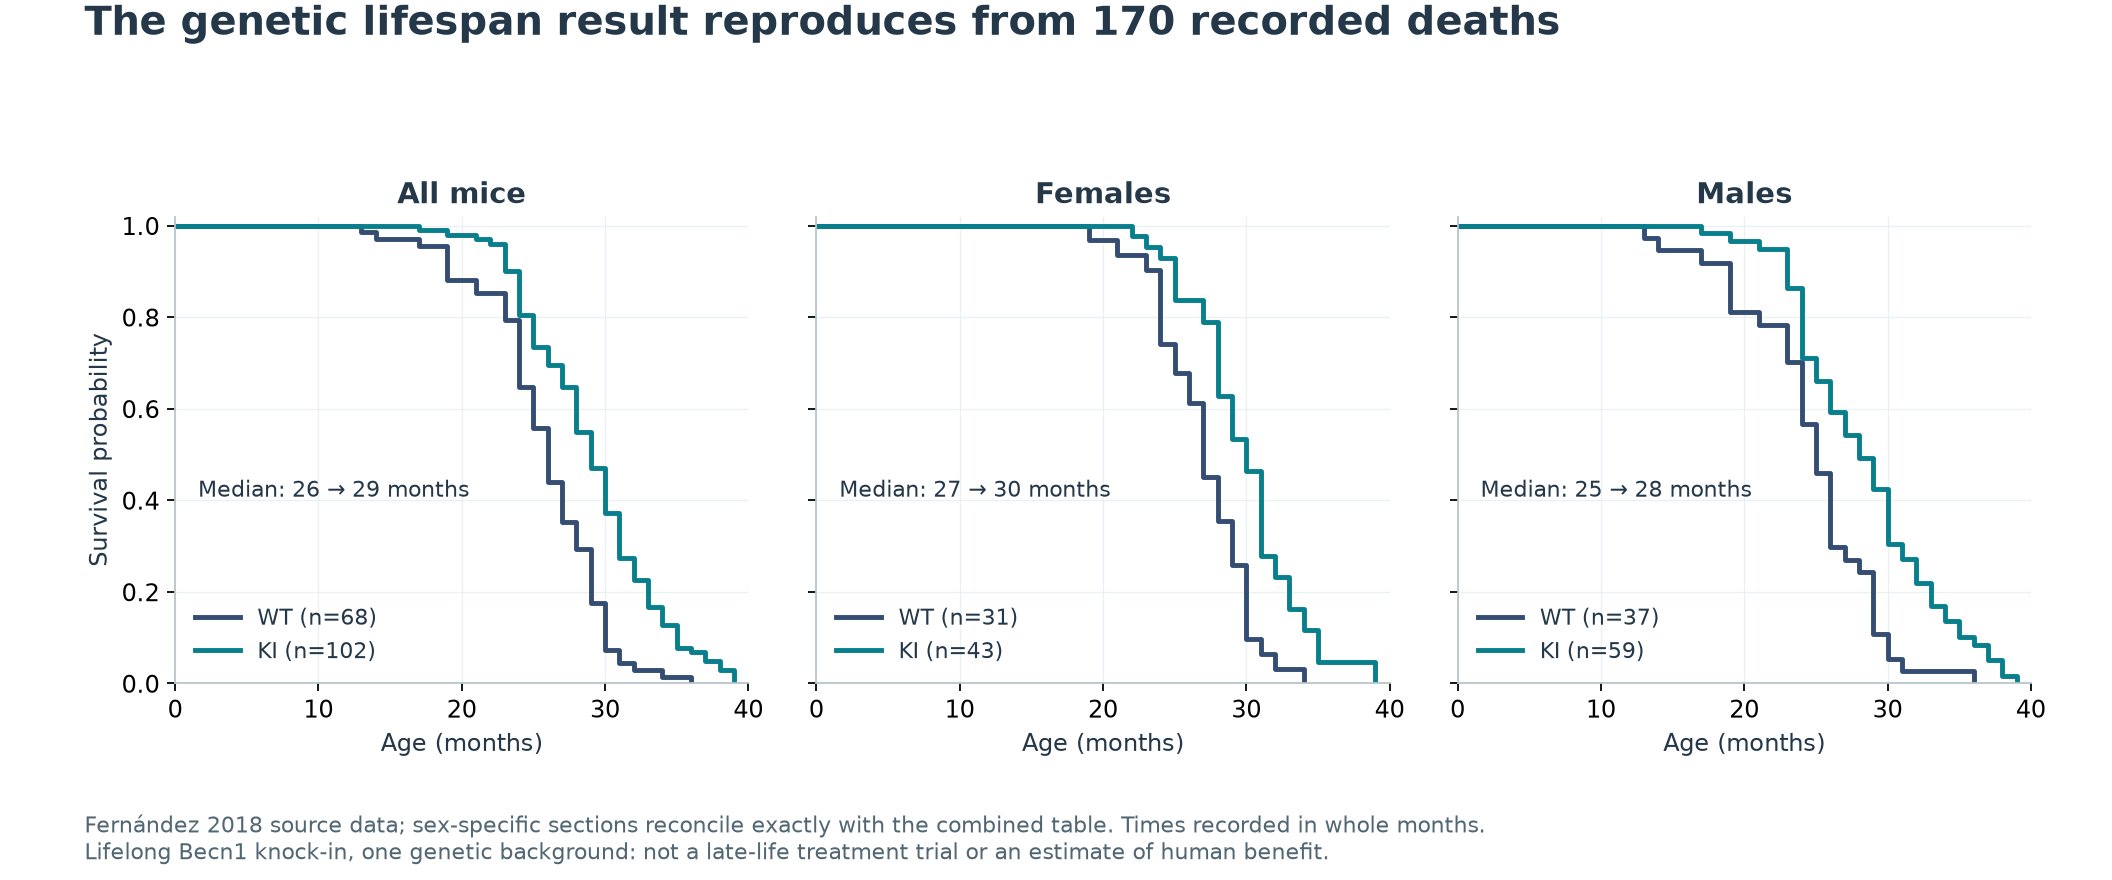
The combined median increased from 26 to 29 months, approximately 11.5%. Female medians were 27 and 30 months; male medians were 25 and 28 months. Over a fixed 0–36-month window, restricted mean survival increased by about 3.17 months, with an approximate 95% interval of 1.85–4.50 months. A median difference, a restricted mean difference and the longest-lived individual are different quantities.
The paper has a correction: the combined and male curves in the original Figure 2 were accidentally duplicated, and the publisher corrected the male panel. We checked the notice, current figure and numerical source table. The graphical error should neither be ignored nor used to dismiss numerical results that reproduce. Correction
A separate 2013 Atg5 transgenic study also reported longer mouse lifespan, providing support under a different genetic manipulation. It is not an independent replication of the Becn1 model, and Atg5 also has functions outside autophagy. Atg5 study
These findings support further investigation of autophagy regulation in mammalian aging, while leaving three connections unresolved:
- Measurement and lifespan were not linked by an individual-level mediation analysis. The data cannot establish how much additional lifespan follows from an extra unit of clearance.
- Tissue changes are not comprehensive functional recovery. Some 2018 pathology comparisons were restricted to animals alive and tumor-free at 20 months. The 2022 follow-up in the same model also found that old liver differed from heart, kidney and skeletal muscle; muscle fiber area is not strength. Old-tissue study
- Lifelong genetic alteration is not late-life treatment. A lifespan gain under one genetic background, environment and manipulation cannot be converted into human years or a product's expected effect.
Human flux experiments exist, but their results need separate interpretations
It is no longer accurate to assume that human autophagy cannot be measured. Researchers can apply paired blockade to collected blood and then analyze marker turnover in blood cells. This remains a measurement in particular samples, cell populations and experimental conditions, rather than the clearance speed of every organ.
A 2025 study of healthy-donor CD4 T cells illustrates the distinction between scales. Fourteen unique donors contributed to nine experiments, with some donors reused. The blocked-to-unblocked LC3 ratio was higher with older age, whereas the corresponding numerical difference showed no clear age effect. Removing the experiment involving a 93-year-old donor also moved the ratio result above the conventional significance threshold. Human cell study
That is not equivalent to saying that older people clear a greater absolute amount. A nonsignificant difference is not evidence that the difference is zero, either. Healthy-donor selection, ex vivo culture, prolonged blockade and donor reuse limit extrapolation to older adults generally or to the intact body.
Dietary interventions reveal another set of boundaries:
| Study | Actual result and measurement | What it does not establish |
|---|---|---|
| 2025 intermittent time-restricted eating study, 121 participants with overweight or obesity and elevated diabetes risk | At six months, the adjusted difference versus standard care was 59.83, with a 95% interval of 4.59–115.06 ng LC3B-II/mg protein/hour. This was an exploratory comparison, p = 0.04, after an overall group test of p = 0.15. | Confirmed improvement in whole-body clearance or a fasting-hour threshold that “switches on” autophagy. |
| 2025 fasting-mimicking diet pilot, 30 participants | The measure was the LC3-II/I ratio under blockade divided by the corresponding untreated ratio. In the supplement, the day-six change in this flux ratio had an overall three-group p = 0.0876. | The p = 0.0035 for change in untreated LC3 ratio cannot be substituted for a significant change in the flux ratio. |
| 2026 protein-reduction crossover trial, 74 healthy adults randomized and 63 completing both periods | The formal abstract reports an adjusted difference of −8.46, with a 95% interval of −24.06 to 7.14, in the same units as the first study; no clear increase. | Ineffectiveness in every tissue or under every nutritional restriction. Full methods were unavailable; carryover and missing-data analyses were not verified. |
Time-restricted eating Fasting-mimicking diet and supplement Protein trial formal abstract
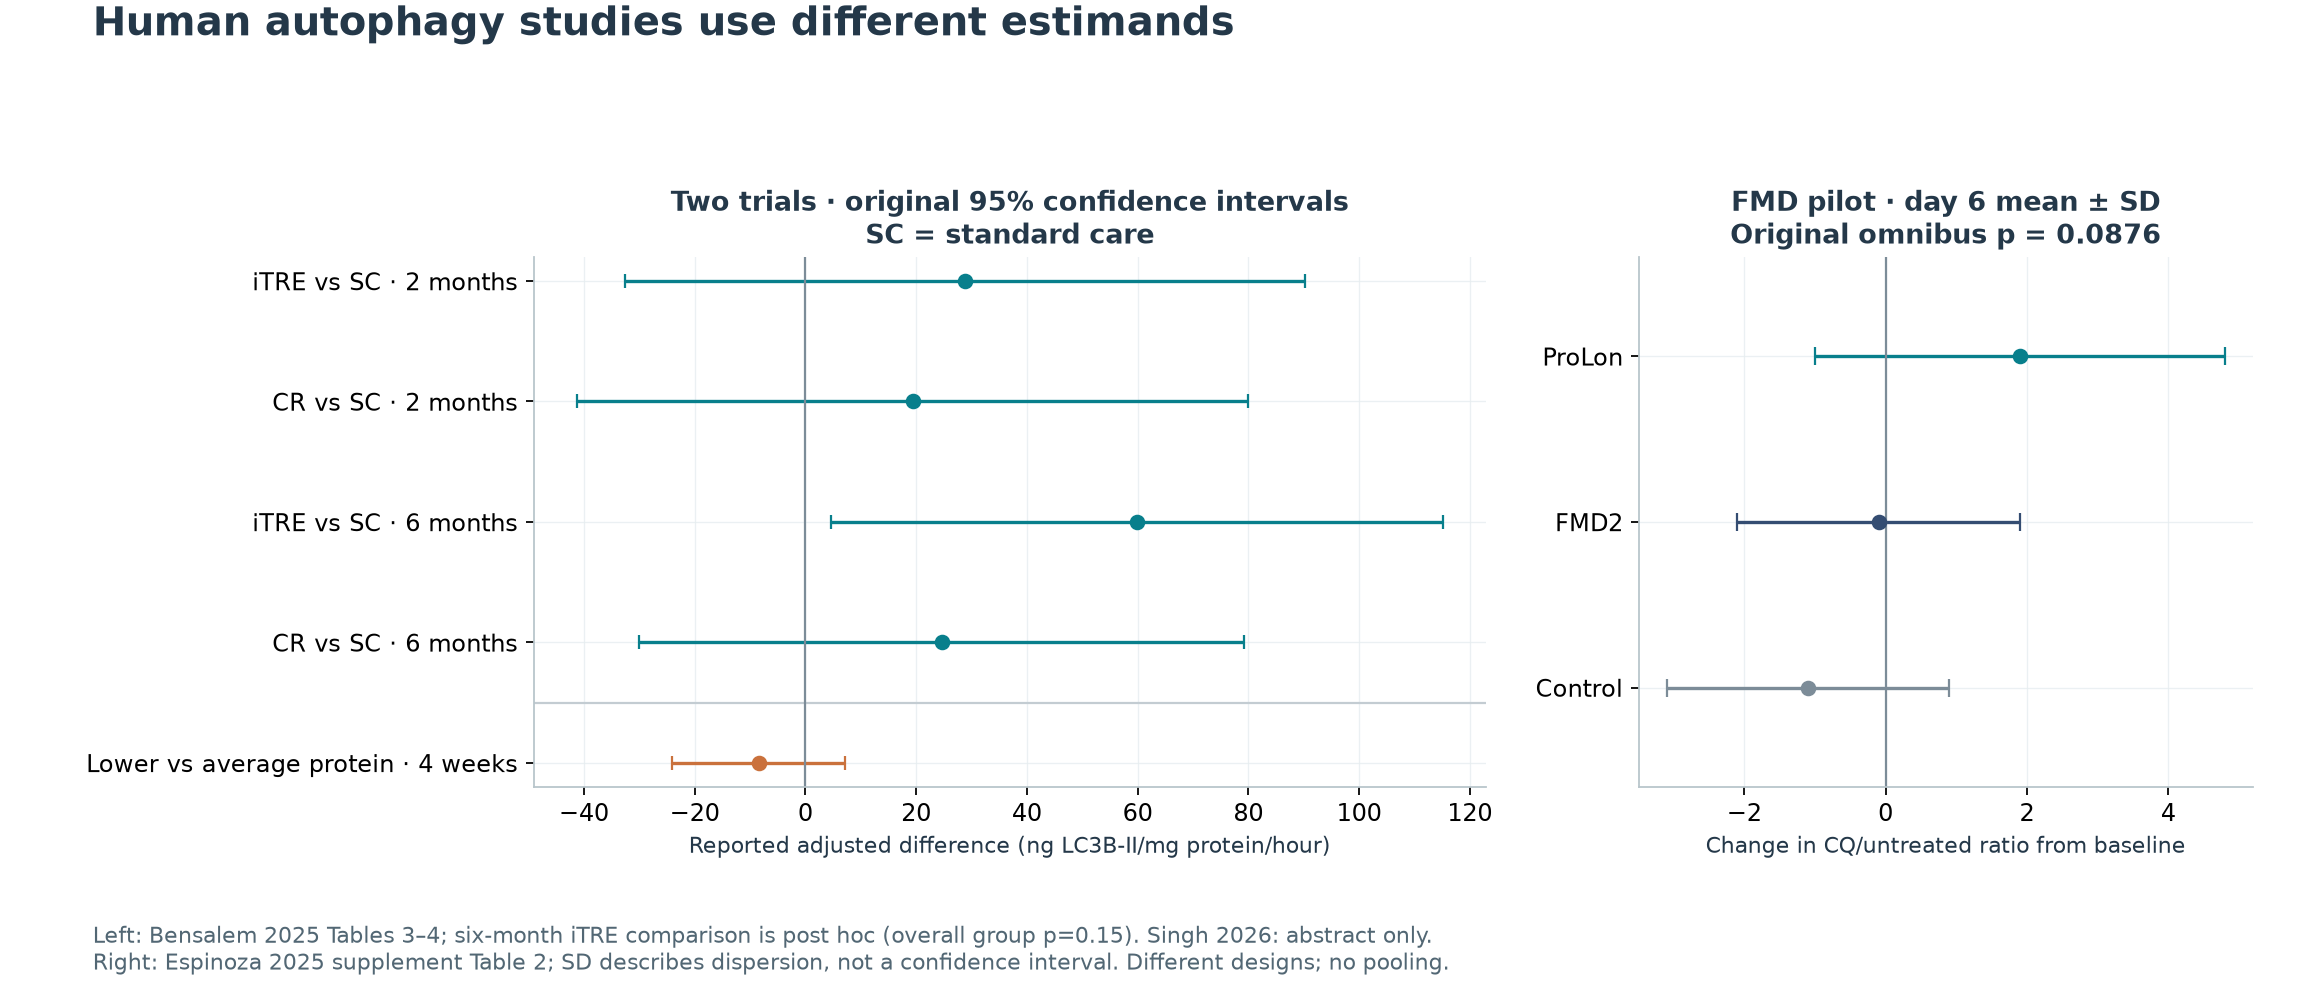
The left panel retains the authors' adjusted effects and 95% intervals. The right panel shows fasting-mimicking-diet means and standard deviations; a standard deviation is not a confidence interval. Different populations, durations and measurement definitions were not pooled into a single dietary effect. We did not obtain participant-level data to refit these trial models.
A nonsignificant within-group change in the time-restricted-eating arm does not automatically negate its difference from control. More relevant concerns are exploratory comparisons, multiplicity, missing samples and external replication. The trial also did not exclude changes in blood-cell composition. Its authors acknowledge that chloroquine can induce noncanonical LC3 lipidation on single membranes, with an uncertain contribution to their readout. Source 7
The fasting-mimicking-diet study illustrates why an abstract's use of “flux” sometimes needs to be checked against the actual measurement in a supplementary table.
What would make the answer more definite?
A persuasive study should let readers follow the same chain: what changed in formation and delivery, what changed in completed substrate clearance, and what changed in cell or organ function. Evidence for one link can be strong without answering the next.
At the measurement level, paired or appropriately grouped blockade, multiple time points, inhibitor validation and substrate-degradation experiments reduce confusion between stock and flow. At the mechanistic level, distinguishing perturbations are needed to test whether reporter behavior, formation feedback or cell composition explains the observations. At the health level, specific functional and disease outcomes must be tested, along with whether the pathway mediates any benefit.
Current evidence supports autophagy as a cellular maintenance process worth investigating and supports lifespan effects of some genetic manipulations in animals. Dynamic human measurements and randomized trials now exist, but gaps remain between a changed readout, an organ benefit and slower aging. A puncta count, a fold change or a redder image cannot supply the complete answer.
Data and reproduction
Download the calculations, numerical extractions and six-figure reproduction package. It includes source-table coordinates, animal-level summaries, group comparisons, survival and restricted mean survival analyses, model conditions and verification code. Figures were redrawn from numerical values for this article.
Statistical reproduction does not independently validate the original experiments, and a mathematical counterexample does not diagnose a study's actual mechanism. Source reading scopes, unavailable materials, research interests and the same-author self-review identity are recorded below.
Scope & limitations
- One author performed research, self-review, translation and editing; not independent human professional review.
- 101 counts animal–tissue means, not globally distinct animals. Source n discrepancies retained with all columns; images, cage/litter and cross-tissue identities not independently validated.
- Small-sample intervals approximate independent-animal inference. Crossing zero is not equivalence; imprecise differences of increments do not refute the entire mechanism.
- Models use illustrative parameters to demonstrate non-uniqueness, not diagnose a study-specific blockage or provide human correction factors.
- Carrier, acidic-compartment and structural turnover do not automatically quantify harmful-cargo clearance, organ function or lifespan mediation.
- Mouse lifetimes recorded in whole months under lifelong genetic manipulation in one background; some pathology samples are tumor-free survivors, not comprehensive healthspan.
- The 2022 supplement and 2025 iTRE supplementary XLSX were unavailable; the 2026 protein paper was read at abstract level. No participant, old-tissue or CD4 individual-model refitting.
- Human populations, windows and flux definitions differ. FMD author means/SD/p retained; superficially similar readouts are not pooled.
- Repeated CD4 donors violate a simple independent sign-test assumption; arithmetic checks do not replace the original mixed model.
Sources
- Klionsky et al. Guidelines for the use and interpretation of assays for monitoring autophagy (4th edition). Autophagy (2021)
methods guideline · Source version: 4th edition, 2021
Reading scope
Relevant sections
Read the stock/flux framework, LC3 carrier versus cargo turnover, incomplete blockade and timing, LC3 normalization, and GFP acidity/degradation cautions. The entire long guideline and all cited experiments were not reviewed.
- Introduction: steady state and flux
- LC3 turnover and carrier versus cargo flux
- Inhibitor cautionary notes; GFP/tandem reporters
- Fernández et al. Disruption of the beclin 1–BCL2 autophagy regulatory complex promotes longevity in mice. Nature (2018)
paper and source data · Source version: 2018 paper; current corrected publisher figure and source files
Reading scope
Relevant sections
Read main results, methods, captions, survival table and reporting summary. Reanalyzed 2,071 fields as 101 animal–tissue means and 170 individual deaths; checked corrected male panel. Direct XML checked 2,852 numbers; 236 R/Python comparisons. Some source groups contain 3–6 animals despite n=3 wording; all columns retained. No image resegmentation or cage/litter adjustment. Some pathology samples are tumor-free survivors, not comprehensive function. Other source sheets/uncropped blots were downloaded but not comprehensively audited.
- Main results and Methods
- Figure1d; Extended Data Figures1a/2c source XLSX
- Figure2 source XLSX; corrected Figure2; Extended Data Table1
- Reporting Summary, study design
- Author Correction: Disruption of the beclin 1–BCL2 autophagy regulatory complex promotes longevity in mice. Nature (2018)
author correction · Source version: 19 June 2018
Reading scope
Relevant sections
Checked duplicated Figure 2a/c and correction of the male panel. The authors state that source data were correct; we separately checked numbers/current figure rather than treating that statement as validation.
- Correction text; Figure2a/c duplication
- Sebti et al. BECN1 F121A mutation increases autophagic flux in aged mice and improves aging phenotypes in an organ-dependent manner. Autophagy (2022 online; 2023 issue)
paper · Source version: 2022 online / 2023 issue
Reading scope
Relevant sections
Read 22-month tissue results, liver differences, muscle fiber area, methods and disclosures. More than 20 fields averaged per mouse; not an independent lifespan replication. Supplement DOCX inaccessible through PMC/publisher/Europe PMC; no animal-table reanalysis and no interpretation of nonsignificance as zero flux.
- Results/Figures1–3
- Discussion: liver and PCT discrepancies
- Methods: autophagy and statistics; funding/disclosure
- Carosi et al. Autophagy across tissues of aging mice. PLOS One (2025)
paper · Source version: 2025
Reading scope
Relevant sections
Read the 96-mouse design, 6/12/18-month tissue/sex findings and methods/limitations. Ratios represent delivery/acidic compartments, explicitly not strict completed flux. Retained RFP persistence, PBMC composition, lipofuscin exclusion, obesity/tumors and absence of >18-month animals. No verified numerical animal table or age-by-sex refit.
- Main Results
- Discussion: limitations
- Methods: animals, microscopy, PBMC and statistics
- Bektas et al. Preservation of Autophagy May Be a Mechanism Behind Healthy Aging. Aging Cell (2025)
paper and supplement · Source version: 2025
Reading scope
Relevant sections
Read main methods/results/discussion and actual supplementary donor table: 14 unique donors, 19 samples, nine experiments. Supplement ages span 23–35, versus 28–35 in parts of the text. Distinguished Baf ratios/differences, continuous-age modeling and donor reuse; retained sensitivity to the 93-year-old experiment. Exact sign-test arithmetic assumes independence and does not replace the reused-donor model. Raw data are available on request; not obtained and no request submitted.
- Results2.1/2.2; Methods4.1–4.5; Discussion
- Supplement FigureS1 and donor table
- Bensalem et al. Intermittent time-restricted eating may increase autophagic flux in humans: an exploratory analysis. Journal of Physiology (2025)
paper · Source version: 2025; publisher web-reader sections plus formal abstract
Reading scope
Relevant sections
Read publisher web-reader methods, Tables 1–4, Figure 3 caption and discussion; retained formal abstract and web-reader response. N121 is not complete data at every visit. Six-month overall p=.15 precedes post hoc iTRE contrast 59.83; no individual refit. Within-arm nonsignificance does not negate the between-arm contrast. PBMC composition and CQ-induced CASM remain unresolved. Direct full-file/supplement XLSX download 403; individual data unavailable.
- Publisher Methods: participants, measurement, statistics
- Tables1–4; Figure3 caption
- Discussion: missingness, PBMC composition and CASM
- Singh et al. Reduced dietary protein intake does not alter autophagy in human blood: A randomized crossover study in healthy adults. Clinical Nutrition (2026)
paper · Source version: 1 September 2026
Reading scope
Abstract
Formal abstract:74 randomized/63 completing both periods, four-week crossover periods/four-week washout, −8.46[−24.06,7.14]. Author result only; no refit/equivalence claim. Full paper unavailable, so sequence/carryover/missingness and complete safety were not verified. PubMed discloses related assay patents.
- Formal structured abstract; PubMed conflict disclosure
- Espinoza et al. Effect of fasting-mimicking diet on markers of autophagy and metabolic health in human subjects. GeroScience (2025)
paper and supplement · Source version: December 2025; actual supplementary DOCX
Reading scope
Relevant sections
Read the 30-person pilot design, ratio assay and main text; directly extracted 63 summary rows from actual DOCX. Untreated LC3 ratio and CQ/untreated ratio are separate: day-six change omnibus p=.0035/.0876. Retained reported p-values without reconstructing Kruskal/participant analyses from rounded means/SDs. Recorded product-company funding/supply and two author affiliations alongside the final no-conflict statement.
- Main design, assay, statistics, results and discussion
- Actual supplement Tables1–2
- Funding, affiliation and conflict statement
- Pyo et al. Overexpression of Atg5 in mice activates autophagy and extends lifespan. Nature Communications (2013)
paper · Source version: 2013
Reading scope
Relevant sections
Read lifespan/autophagy results, transgenic generation and longevity methods. Main 65 WT/70 Tg cohort and additional founder lines provide background evidence. Different genetic manipulation is not independent Becn 1 replication. No individual survival-table reanalysis or comprehensive functional-assay audit.
- Results: extended lifespan and autophagy markers
- Methods: generation of mice, longevity study and statistics
Authorship & review
Author self-review · Codex (AI agent)
2026-09-21 · Same-author Codex review of 2018 originals/correction/source tables and 2022–2026 measurement boundaries. Retained n discrepancies; fields averaged within animals without invented pairing or replication. Distinguished increments/endpoints, carrier/cargo, differences/ratios and acidic compartments/completed processing. Checked 170-mouse survival, both languages and six figures; corrected our compartment-unit label, comparators/SD annotation, human applicability and CASM boundaries. Independent XML checked 2,852 source entries; 236 R/Python values and risk-set formulas passed, with analytical/ODE agreement and 23 identical fresh outputs. Original experiments/human individual models not rerun; not independent human review. Website/publication checks recorded separately.
Remaining limitations:
- One author performed research, self-review, translation and editing; not independent human professional review.
- 101 counts animal–tissue means, not globally distinct animals. Source n discrepancies retained with all columns; images, cage/litter and cross-tissue identities not independently validated.
- Small-sample intervals approximate independent-animal inference. Crossing zero is not equivalence; imprecise differences of increments do not refute the entire mechanism.
- Models use illustrative parameters to demonstrate non-uniqueness, not diagnose a study-specific blockage or provide human correction factors.
- Carrier, acidic-compartment and structural turnover do not automatically quantify harmful-cargo clearance, organ function or lifespan mediation.
- Mouse lifetimes recorded in whole months under lifelong genetic manipulation in one background; some pathology samples are tumor-free survivors, not comprehensive healthspan.
- The 2022 supplement and 2025 iTRE supplementary XLSX were unavailable; the 2026 protein paper was read at abstract level. No participant, old-tissue or CD4 individual-model refitting.
- Human populations, windows and flux definitions differ. FMD author means/SD/p retained; superficially similar readouts are not pooled.
- Repeated CD4 donors violate a simple independent sign-test assumption; arithmetic checks do not replace the original mixed model.
Editorial approval · Codex (AI agent)
2026-09-21 · Same-author Codex review of 2018 originals/correction/source tables and 2022–2026 measurement boundaries. Retained n discrepancies; fields averaged within animals without invented pairing or replication. Distinguished increments/endpoints, carrier/cargo, differences/ratios and acidic compartments/completed processing. Checked 170-mouse survival, both languages and six figures; corrected our compartment-unit label, comparators/SD annotation, human applicability and CASM boundaries. Independent XML checked 2,852 source entries; 236 R/Python values and risk-set formulas passed, with analytical/ODE agreement and 23 identical fresh outputs. Original experiments/human individual models not rerun; not independent human review. Website/publication checks recorded separately.
Translation check · Codex (AI agent)
· Same author compared both languages paragraph by paragraph: animal units, contrasts/intervals, model assumptions, medians/RMST, human designs, published p-values, missing originals, six figure labels and limitations. English metadata included. Not independent human language review.
Funding & interests
This task accepted no funding from the discussed product companies and includes no promotional links. The same Codex agent performed research, self-review, translation and editing.
Funding of cited research
Fernández et al. (2018) disclose B.L. as a scientific founder of Casma Therapeutics. The 2022 follow-up reports public/foundation support and no potential conflicts. The 2026 protein paper PubMed record discloses TJS/JB assay patents. L-Nutra funded and supplied the FMD study and is the affiliation of two authors; its final statement also declares no competing interests. The read CD4 and cross-tissue papers declare no conflicts. Unavailable disclosures are not presumed absent. Interests do not replace methodological evaluation.