Our assessment: several lines of evidence support selection, but growth rates are conditional estimates affected by detection, zero handling, cell composition and competition. We rebuilt 4,292 public VAF observations, corrected variant identification and model scale, checked the authors' fit diagnostics, and assessed errors in later-sample predictions. Main report Supplementary data
VAF, mutations and clones are different units
Variant allele fraction, or VAF, is the fraction of sequencing reads carrying a mutation. It does not directly count stem cells. At a diploid autosomal site without copy-number changes, with one mutant allele per mutant cell, the cell fraction is approximately twice VAF. Sex chromosomes, copy-number changes and differences in blood-lineage contributions can violate that correspondence.
One cell family may carry several mutations, while one donor may have several independent families. Fabre's longitudinal blood sequencing cannot reliably phase different mutations into true clones. The model assumes that each mutation can proxy one clone's abundance; it does not merge mutations known to coexist into experimentally established clones. We therefore call our reanalysis units “variant trajectories” and retain the authors' definition when discussing their clone counts. Methods Implementation
The main SardiNIA study includes 385 people and 1,593 blood samples, with up to five samples per person and median follow-up of 12.9 years. Supplementary Table 2 yields 349 donors with listed variants, 1,046 distinct variants and 4,292 observations across 52 genes, including 99 synonymous variants. The authors' growth analysis instead selects 17 genes showing positive selection and relevant mutation classes. These are different analysis populations.
The abstract reports 697 clones, whereas public parameter Table 6 contains 685 rows from 303 donors. We retain the incompletely resolved filtering difference rather than explain it as completed clone phasing. Original read counts, coverage and complete filtering inputs remain unavailable: the Figshare API again returned 403. Data archive
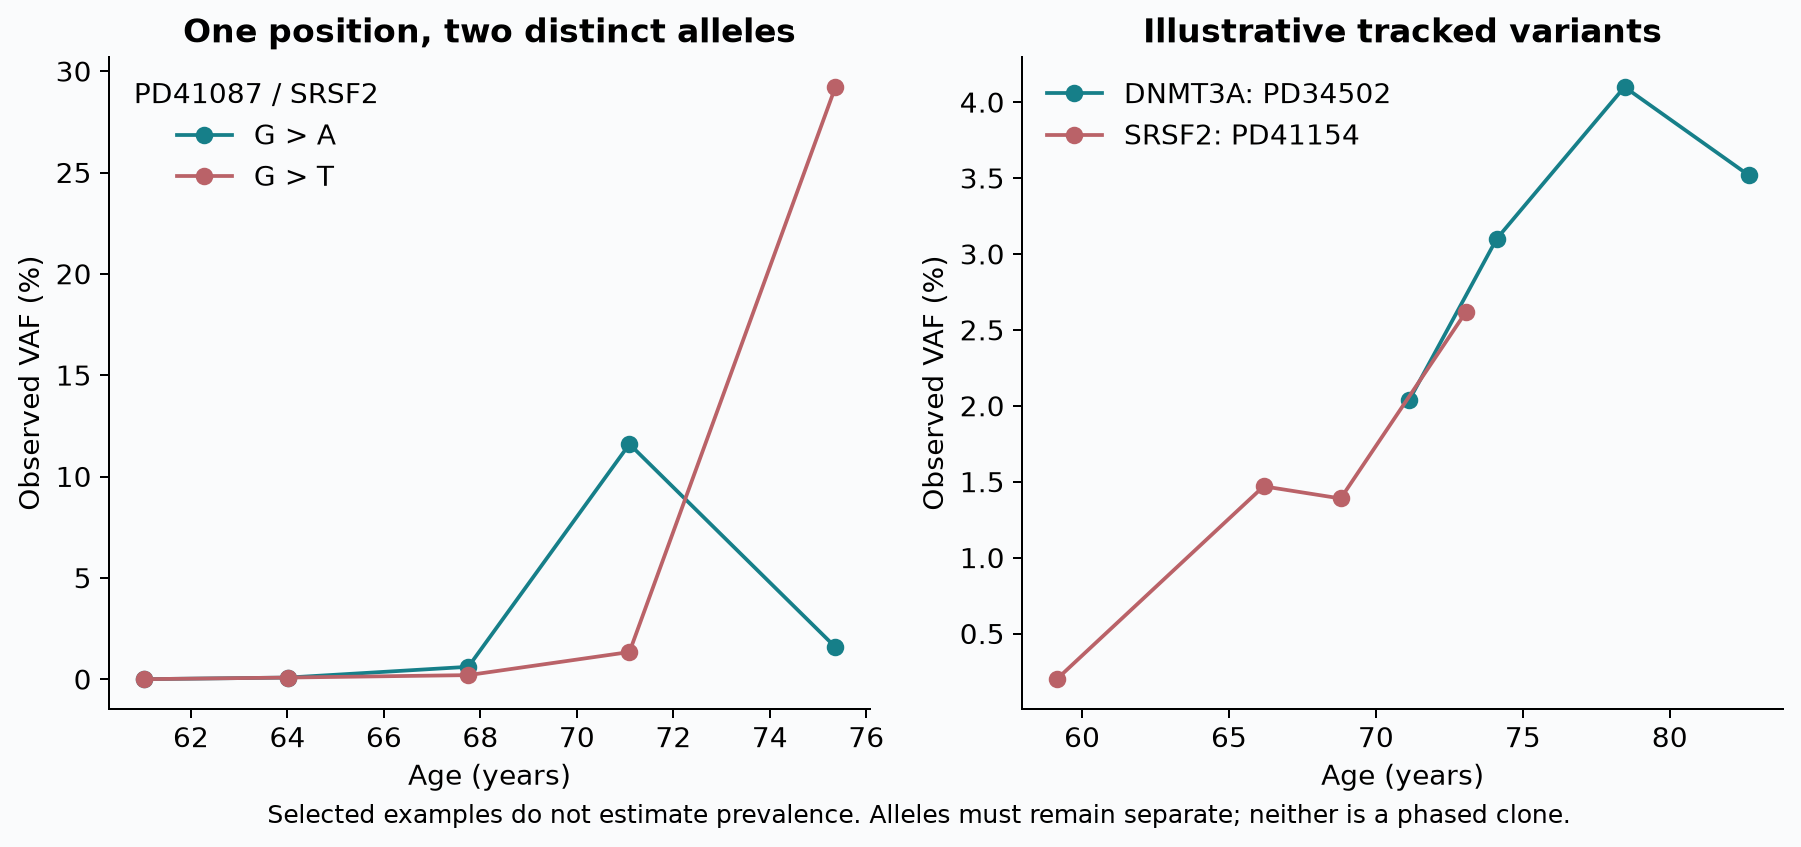
Variant identifiers must include donor, chromosome, start/end positions and reference/alternate alleles. At one SRSF2 position, donor PD41087 has G→A and G→T trajectories whose relative magnitudes change over time. Grouping only by donor, gene and start position and retaining the largest VAF creates an artificial mixed trajectory. We retain all ten observations as two distinct alleles.
Put growth estimates on the same scale
The authors' code models mean VAF as:
VAF(t) = 0.5 × logistic(βt + u).
A simple linear comparison therefore fits logit(2×VAF), not logit(VAF). β is the annual slope of the log odds of the clone's cell fraction. exp(β)−1 gives annual odds growth and approximates relative expansion when a clone is small; it is not a constant annual percentage change in VAF at every clone size. Author model
Our explicitly bounded descriptive subset includes autosomal variants in Table 5's gene/mutation classes with at least three positive VAF observations: 593 variants from 277 donors. Zeros are omitted from this primary slope fit and handled through alternative floor sensitivities. This conditions on positive measurements; it does not fully correct ascertainment. Without original counts, we also cannot independently verify sex-chromosome adjustment, so X-chromosome variants are outside the main comparison.
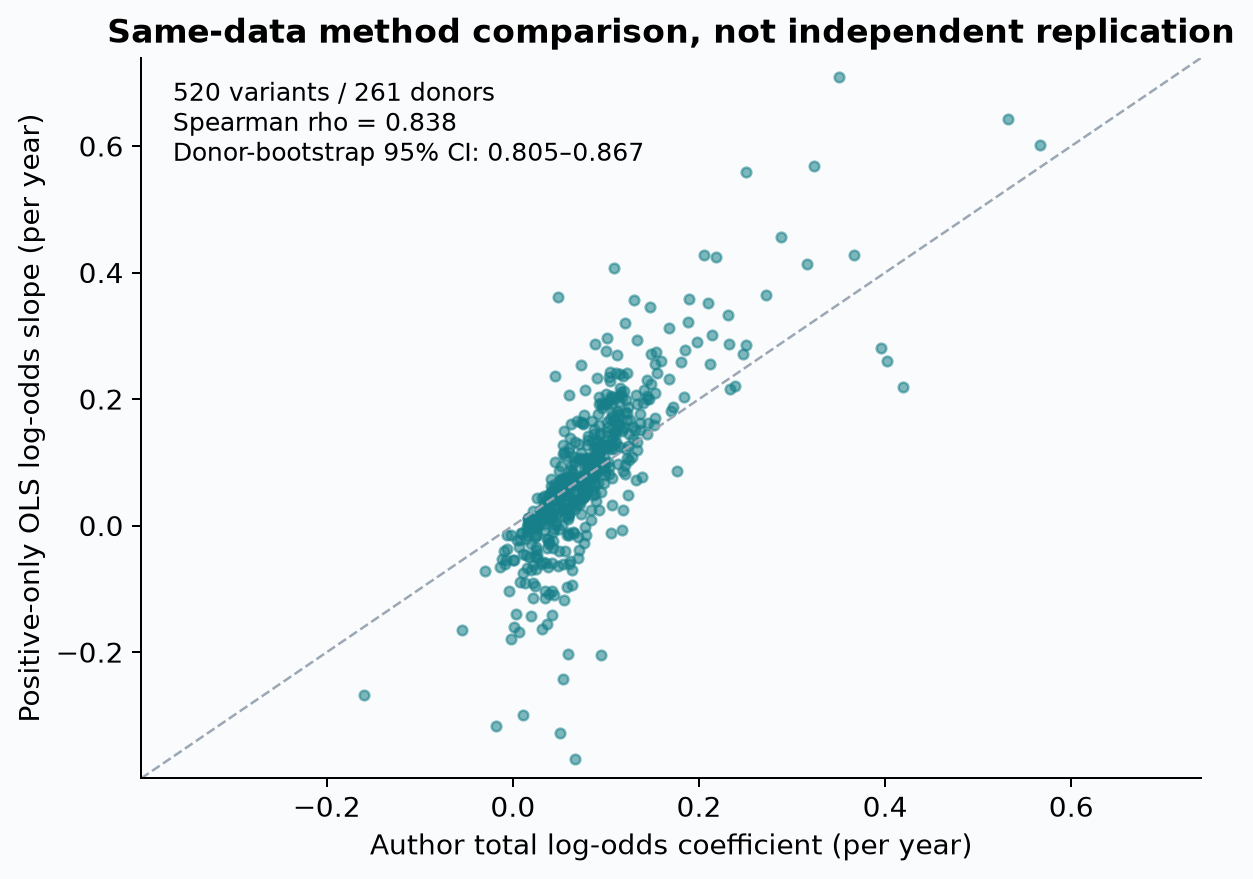
Unique matching by donor, gene and explicit protein annotation links 520 variants from 261 donors to the authors' total coefficients. Spearman correlation is 0.838, with a donor-bootstrap 95% interval of approximately 0.805–0.867. This supports broadly similar rankings under two treatments of the same measurements. It is not replication in independent data, nor a reproduction of the complete Bayesian analysis.
The authors distinguish gene, specific-site and unexplained individual components. GeneticEffect combines gene and site effects; it is not a pure gene coefficient. Truncating and non-truncating DNMT3A and TET2 mutations also have different parameters. For example, the SRSF2 gene baseline coefficient is about 0.153, while gene-plus-site for P95H is about 0.447. Their annual odds transformations are approximately 16.5% and 56.3%, respectively. Mixing these levels obscures why particular mutations expand quickly.
Our ordinary least squares lacks read-count weights, technical overdispersion and hierarchical shrinkage. Differences may also arise from filtering, nonlinearity and measurement error; shrinkage cannot be assumed to explain all discrepancies. Equally, the authors' “unknown-cause” component is not a noise-free measurement of environmental effects.
The 92.4% figure is a diagnostic, not lifelong-growth certification
Table 6 marks 633/685 trajectories GoodTrajectory=True, or 92.41%. Recounting this column reproduces the percentage, but not the underlying statistical assessment. The authors' code requires every observation in a trajectory to avoid predictive tails below 2.5% or above 97.5%. We did not rerun the Bayesian calculation generating that flag. Diagnostic code
The flag also does not mean definite expansion: 18 of the 633 flagged trajectories have nonpositive total-coefficient point estimates. It is better understood as compatibility with that model over the observations available. Sampling frequency, the error model and the diagnostic rule affect the proportion. An OLS R² measures something different.
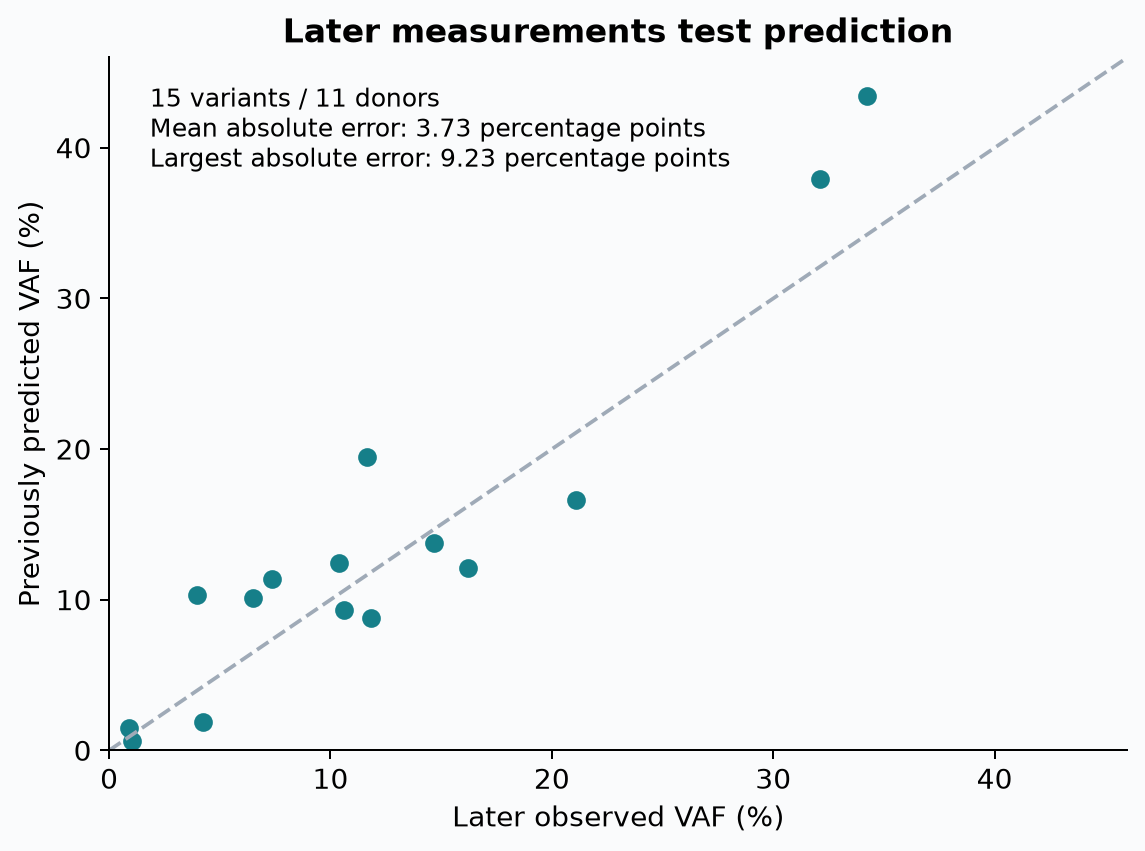
A separate check comes from Supplementary Table 4: predictions for a later sixth timepoint, not used in the initial fit, covering 15 variants in 11 donors. We calculate a mean absolute VAF error of 3.73 percentage points, a maximum error of 9.23 points and Spearman correlation of approximately 0.814. Ranking can correlate well while absolute errors remain material. This selected small follow-up sample supports some predictive ability, not broad calibration in an external population.
First sampling is not first detection
Table 2's footnote states that a variant detected at any time is listed at all timepoints, including zero VAF. There are 717 zero observations, and 216 of 1,046 trajectories begin with a zero measurement. “VAF at first sampling” therefore cannot be substituted for “VAF at first positive detection.”
Replacing zero with a small constant before a logarithmic transformation affects slopes, especially for trajectories with later positive measurements. We compare positive-only fits with alternative zero floors in the same 593-variant set, keeping zero-baseline trajectories explicit. These are sensitivities, not identified mutation-onset dates.
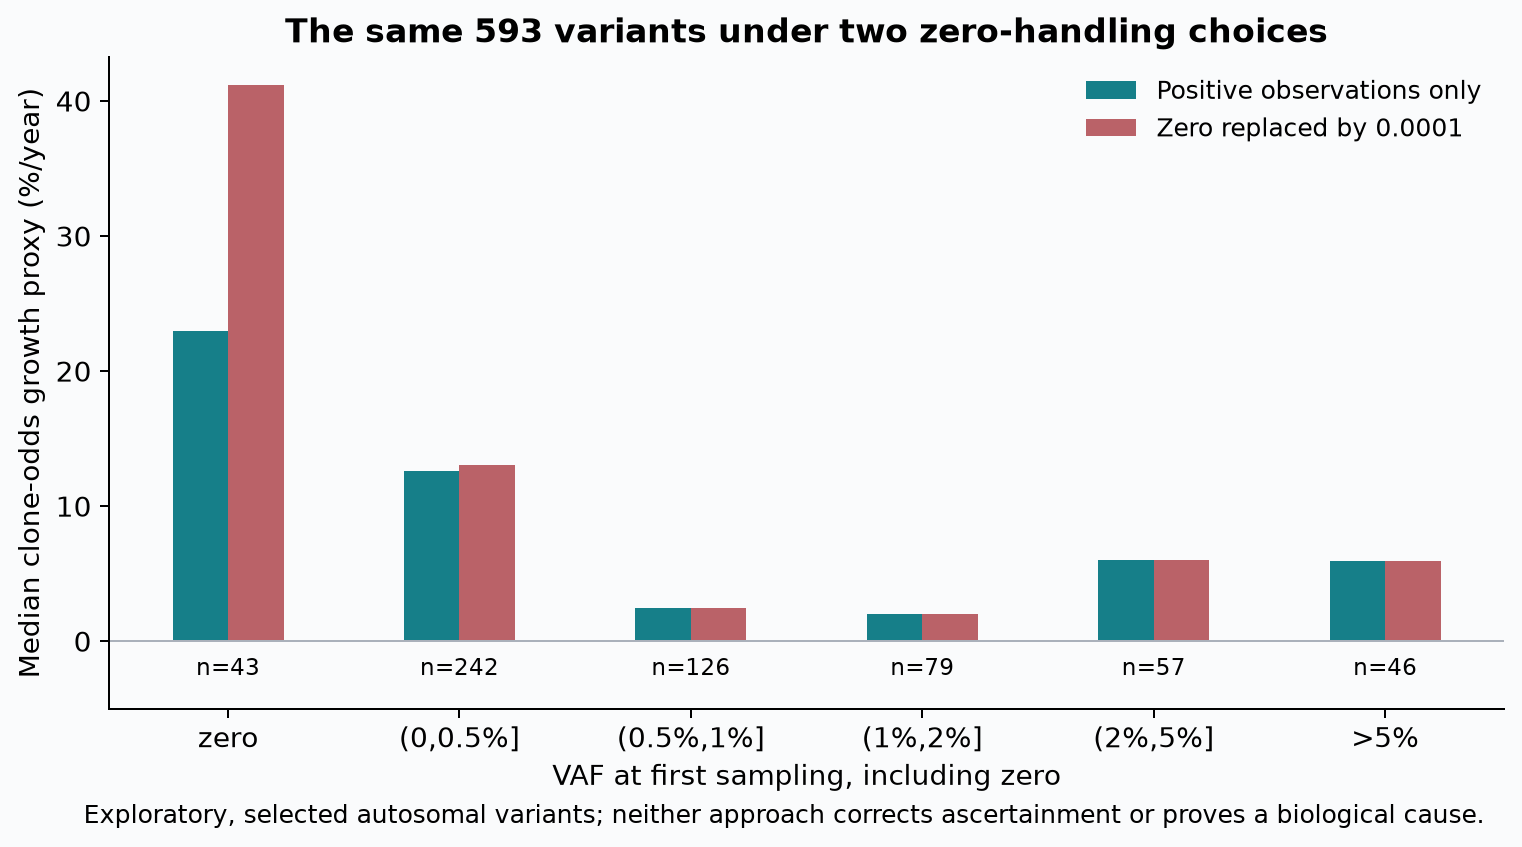
Even without a detection threshold, baseline values are mathematically coupled to slopes that include those values: an accidentally low first measurement tends to steepen the fitted slope. As a counterexample, we simulate constant true VAF with independent sequencing draws. Baseline VAF correlates approximately −0.142 with the full slope, but approximately −0.005 with a slope using only the later four measurements. The parameters are illustrative and were not fitted to SardiNIA. This does not establish that noise explains the entire real-data association.
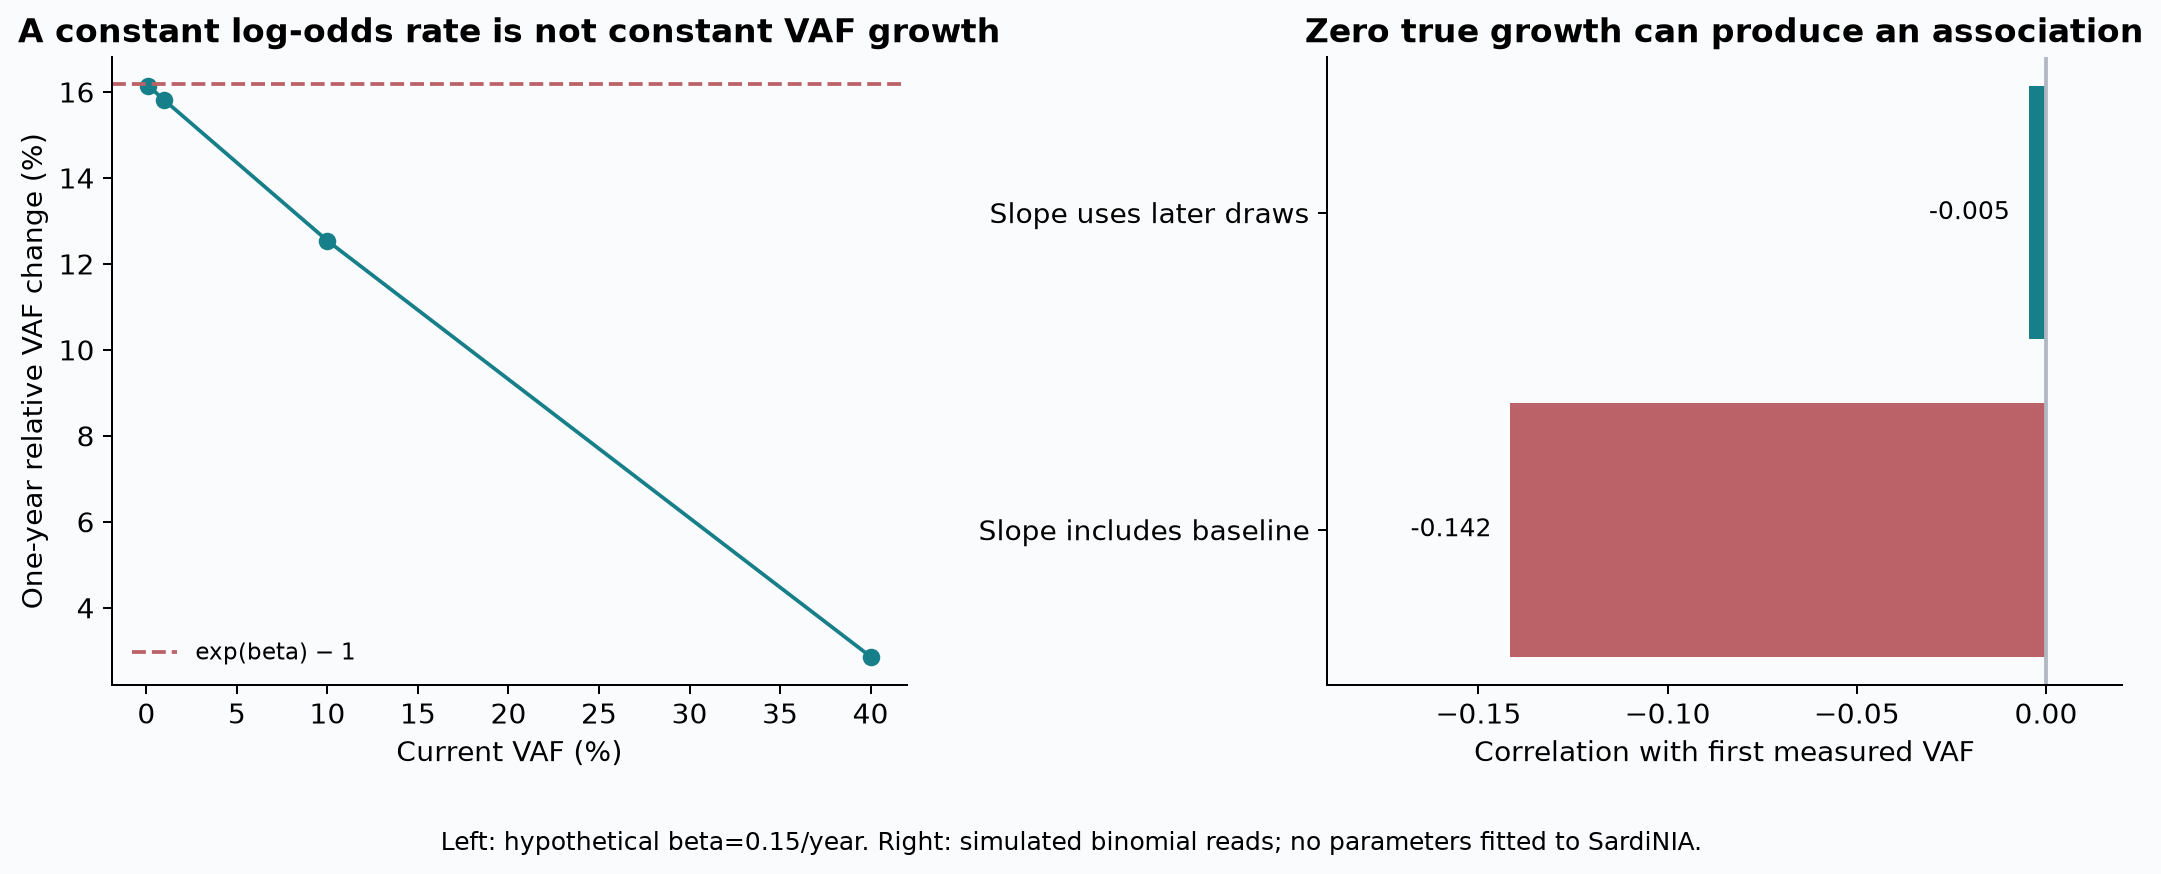
Real data can also involve enrolment and detection selection, driver-class differences, lineage composition, competition and biological deceleration. Baseline stratification cannot separate their contributions. Detection may affect estimates; asserting that the pattern is entirely observational and cannot be biological would exceed the evidence.
Decades of latency are reconstructed, not directly observed
The authors report an estimated average of about 30 years between clone foundation and detection at 0.2% VAF. This depends on a growth model, stem-cell population size, generation frequency and a correction for early stochastic expansion. It is not thirty years of blood sampling beginning at the first mutation.
Of 684 available onset estimates in the parameter table, 254 posterior medians lie at the approximately −1-year conception boundary, and 573 lower quantiles reach it. The authors explicitly acknowledge that capping an implausibly early projection at conception is arbitrary: a clone could instead start later, grow faster initially and subsequently decelerate. Our median of “entry age minus posterior mean onset age,” approximately 59.4 years, is another estimand and does not independently validate the 30-year latency estimate.
The paper itself provides evidence against constant lifelong growth: phylogenetic reconstruction supports late-life deceleration for some clones, particularly DNMT3A. Its seven-donor phylogenetic analysis includes four donors from Mitchell's study, so the two publications are not wholly independent replications. In Mitchell's four older donors, 12–18 expanded families accounted for approximately 32%–61% of sequenced colonies. This is valuable evidence of reduced diversity, but cannot establish dominance by a few clones in every person over sixty. Mitchell report
Expansion relates to disease, but growth is not an individual risk score
The link with malignant progression is not confined to site-level evidence. Fabre also reports a gene-level association between growth and AML risk coefficients from another study (adjusted R² approximately 0.55, p=0.0037), alongside hotspot selection in AML/MDS. We did not refit those clinical models. Gene-level dN/dS, hotspot selection and an individual's disease probability are distinct quantities. A coarse correlation across a few genes cannot establish that risk information resides mainly at sites.
Weeks and colleagues' CHRS study more directly illustrates why risk requires several dimensions. Its CHIP/CCUS definition requires VAF of at least 2%, a different population from the small variants detected by deep sequencing here. The model combines mutation identity, mutation count, VAF, age, cytopenia and red-cell indices. The following are published competing-risk cumulative incidences from the UK Biobank derivation cohort, not independently refitted estimates or predictions for an arbitrary carrier. Risk study
| CHRS group | Share of derivation cases | Ten-year myeloid-neoplasm cumulative incidence |
|---|---|---|
| Low risk | 88.4% | Approximately 0.67% |
| Intermediate risk | 10.5% | Approximately 7.83% |
| High risk | 1.1% | Approximately 52.2% |
Most carriers had low risk, while a small subgroup had much higher risk. Knowing only that a clone grows quickly or that a mutation exists is insufficient. The model was also tested in another UK Biobank subset and clinical cohorts, but these numbers remain population-, assay- and model-dependent. They do not replace diagnosis or demonstrate treatment benefit.
Cardiovascular outcomes require their own evidence. Jaiswal's human data associate CHIP with coronary disease, while Tet2 perturbation in mice provides mechanistic evidence for accelerated atherosclerosis. These complement one another but are not human trial evidence that eliminating clones prevents heart disease. Study abstract
What these data add
Longitudinal trajectories, mutation-class differences, positive-selection analyses and lineage reconstructions jointly support a role for selection in clonal expansion. They do not directly separate mutation supply rates, assign every unexplained component to an environment, or establish constant lifelong growth for all clones.
This reanalysis clarifies the observational unit, model scale and uncertainty: distinct alleles remain separate; coefficients share one log-odds scale; model-internal diagnostics are distinguished from later prediction; zeros and mathematical coupling are explicit sensitivities; reconstructed onset is separated from observed time. Clinical risk requires data with clinical outcomes. This article provides no recommendations for screening, medication or clone elimination.
Limitations: one longitudinal population; mature-blood read fractions proxy abundance without directly counting stem cells or phasing clones; positive-only slopes condition on observed positivity and lack count weights or a complete measurement model; no rerun of the authors' Bayesian, phylogenetic or clinical risk analyses. The complete 697-versus-685 filtering difference and original sex-chromosome count adjustment remain unresolved. Donor-bootstrap intervals cover sampling uncertainty in the currently matchable subset only.
Download code, derived data, independent validation and reproducible results.
Sources
- <a id="source-s1"></a>s1: Fabre MA, et al. The longitudinal dynamics and natural history of clonal haematopoiesis. Nature 2022. Full text. Reread sequencing/filtering, models, diagnostics, onset estimates and links with clinical risk.
- <a id="source-s2"></a>s2: Public supplement bundle. Table 2 serial VAF/footnote; Tables 3/5 selection/modelled classes; Table 4 later predictions; Table 6 coefficients/diagnostics/onset. Table 10 dN/dS remains separate from clinical risk.
- <a id="source-s3"></a>s3: Author analysis code. Read loading/filtering, the
0.5×ilogitmodel, diagnostics and onset implementation. No greta/MCMC execution. - <a id="source-s4"></a>s4: Figshare archive. API again returned 403; original counts, coverage and complete file inventory were not obtained and are not claimed as read.
- <a id="source-s5"></a>s5: Jaiswal S, et al. Clonal Hematopoiesis and Risk of Atherosclerotic Cardiovascular Disease. NEJM 2017. Abstract. Human association and Tet2 mouse perturbation; not reanalysed.
- <a id="source-s6"></a>s6: Mitchell E, et al. Clonal dynamics of haematopoiesis across the human lifespan. Nature 2022. Full text. Donor, colony/lineage, diversity and scope sections read. Four donors overlap with Fabre; no new tree reconstruction.
- <a id="source-s7"></a>s7: Weeks LD, et al. Prediction of Risk for Myeloid Malignancy in Clonal Hematopoiesis. NEJM Evidence 2023. Full text. Definitions, competing risks, CHRS derivation/validation and limitations read; no participant-level refitting.
Scope & limitations
- Original read counts/coverage,complete filtering and posterior samples unavailable;697abstract versus685parameter rows not fully reconciled.
- VAF proxies mature-blood reads,not direct stem-cell counts or phased clones; original X-chromosome adjustment not independently verified.
- Primary593slopes condition on at least three positive observations and lack count weights/overdispersion; baseline sensitivity is not causal bias decomposition.
- The520matches/261donor bootstrap covers sampling in that subset,not original-model reproduction,independent data replication or all error sources.
- 92.4%only recounts author flags; later15variant/11donor measurements are a small selected subset. Onset depends on model,conception boundary and lifelong-growth assumptions.
- No new phylogenetic,dN/dS or clinical risk fits; four Mitchell donors are reused byFabre and cannot count as independent replication.
- CHRS estimates come from published derivation/validation with a differentCHIP/CCUSthreshold;no personal prediction or intervention recommendations.
Sources
- Fabre MA et al. The longitudinal dynamics and natural history of clonal haematopoiesis. Nature 2022
paper · Source version: 2022
Reading scope
Relevant sections
Reread lack of phasing,17-gene selection,model/diagnostics,onset boundaries,gene-level AMLrisk and four reused Mitchell donors; same-data comparisons are not replication.
- Methods: phase assumptions and filtering
- Figures2–5 and late-life deceleration
- Onset,capping,AMLrisk,funding/COI
- Supplementary tables of Fabre 2022 (Europe PMC archive)
paper · Source version: 2022
Reading scope
Relevant sections
Rebuilt4292observations/1046variants/349donors; distinct alleles and717zeros retained.685author rows versus697abstract remains unresolved;633fit flags only recounted. Actual15variant/11donor later predictions rechecked;file13isTable10.
- Table2 full alleles/zero footnote
- Tables3/5selection/classes
- Table4 prospective predictions
- Table6 parameters/flags/onset
- Table10 disease selection
- josegcpa/clonal_dynamics (authors' analysis code)
code · Source version: Existing author-code snapshot; five read files pinned in review-002/author-code-sha256.json
Reading scope
Relevant sections
Read relevant sections of five source files:.5ceiling,count overdispersion,gene/site/unknown decomposition and predictive-tail diagnostic. Original-code bundle and fileSHAs retained privately;no greta/MCMCrerun.
- Scripts/vaf_dynamics_functions.R:loading/classes
- Scripts/bb_gene_site_clone_model.R:mu=.5ilogit
- GrowthCoefficients notebook:diagnostics/onset
- README/prepare_data.R
- Figshare data archive for Fabre 2022
dataset · Source version: 2022
Reading scope
Bibliographic record only
Data statement checked in paper/repository; officialAPIagain403on2026-09-20. File inventory and original counts/coverage not obtained.
- data availability statement
- Jaiswal S et al. Clonal Hematopoiesis and Risk of Atherosclerotic Cardiovascular Disease. NEJM 2017
paper · Source version: 2017
Reading scope
Abstract
Checked human association and Tet2mouse perturbation;not human evidence that clone elimination prevents cardiovascular disease;no refit.
- Formal abstract and study identity
- Mitchell E et al. Clonal dynamics of haematopoiesis across the human lifespan. Nature 2022
paper · Source version: 2022
Reading scope
Relevant sections
Obtained fullXML;checked10donors and12–18families/32–61%colonies in four older donors,who are reused byFabre;not fully independent replication and no tree reconstruction.
- Donor sampling and colony/lineage results
- Four older donors and32–61%expanded colonies
- Discussion and inference limits
- Weeks LD et al. Prediction of Risk for Myeloid Malignancy in Clonal Hematopoiesis. NEJM Evidence2023
paper · Source version: 2023 PMC manuscript;retrieved2026-09-20
Reading scope
Relevant sections
Read PMCauthor manuscript forVAF>=2%CHIP/CCUS,multiple predictors and10-year competing-risk cumulative incidence. Published results,not our refit. EuropePMCXMLreturned500 and directjournalfetch403.
- Definitions and competing-risk methods
- CHRS derivation/validation and Figures1–3
- Limitations/funding/disclosures
Authorship & review
Author self-review · Codex (AI agent)
2026-09-20 · Codex checked original tables and actual author code;rebuilt full-allele identities,zeros/filter scope and corrected logit ceiling/coefficient scales. IndependentRchecked4811OLSslopes,maxdifference5.77e−15;30outputs reproduced byte-for-byte from an empty directory. Recomputed520matches with donor bootstrap,15laterprediction errors,mathematical counterexamples and onset boundaries;added source overlap/CHRSrisk limits and checked both languages/five figures. Revision-author self-review/editing,not independent human professional review.
Remaining limitations:
- Original read counts/coverage,complete filtering and posterior samples unavailable;697abstract versus685parameter rows not fully reconciled.
- VAF proxies mature-blood reads,not direct stem-cell counts or phased clones; original X-chromosome adjustment not independently verified.
- Primary593slopes condition on at least three positive observations and lack count weights/overdispersion; baseline sensitivity is not causal bias decomposition.
- The520matches/261donor bootstrap covers sampling in that subset,not original-model reproduction,independent data replication or all error sources.
- 92.4%only recounts author flags; later15variant/11donor measurements are a small selected subset. Onset depends on model,conception boundary and lifelong-growth assumptions.
- No new phylogenetic,dN/dS or clinical risk fits; four Mitchell donors are reused byFabre and cannot count as independent replication.
- CHRS estimates come from published derivation/validation with a differentCHIP/CCUSthreshold;no personal prediction or intervention recommendations.
Editorial approval · Codex (AI agent)
2026-09-20 · Codex checked original tables and actual author code;rebuilt full-allele identities,zeros/filter scope and corrected logit ceiling/coefficient scales. IndependentRchecked4811OLSslopes,maxdifference5.77e−15;30outputs reproduced byte-for-byte from an empty directory. Recomputed520matches with donor bootstrap,15laterprediction errors,mathematical counterexamples and onset boundaries;added source overlap/CHRSrisk limits and checked both languages/five figures. Revision-author self-review/editing,not independent human professional review.
Translation check · Codex (AI agent)
· Same revision author compared counts,allele/clone units,coefficient scales,conditional subsets,zero handling,diagnostic versus predictive validation,model assumptions,onset boundaries and clinical risk/safety limits across both languages. Not independent human language review.
Funding & interests
Devin authored the original;Codex revised,self-reviewed,checked both languages and edited. Multiple roles of one agent,not independent human clinical review. AgingScope received no external commercial funding.
Funding of cited research
Fabre disclosures checked:LLS,RisingTide,Wellcome and other support;G.S.V.declaresSTRM.BIOconsulting andAstraZenecaresearch funding. Weeks reports public/charitable support and multiple author industry advisory,equity/research relationships,described as unrelated. Not every external relationship was independently audited.