The answer first
Among 12,069 US adults aged 40–79 (1,587 deaths, up to 13 years of follow-up), the step that matters most is whether someone does any leisure exercise at all (hazard ratio 0.64); among people who already exercise, we cannot detect any further gradient with dose. But a large share of that 0.64 is not an effect of exercise: once early deaths and people with baseline illness are progressively removed, it shrinks to 0.85 and loses statistical support. The one long-term trial that randomised older adults to a structured activity programme did reduce mobility disability (one case avoided per 18 participants over 2.6 years) — but it did not reduce deaths.
| What we did | What we got | What it does not answer |
|---|---|---|
| Checked every published frequency cell in the official codebooks against our import | All 368 cells match; leisure, work/chores and transport constructed separately following the skip logic | A correct import says nothing about whether the reported minutes are accurate |
| Fitted weighted Cox models honouring the survey design (weights, strata, PSUs) | Any leisure MVPA vs none: hazard ratio 0.64 (95% CI 0.56–0.72) | This is an association, not a randomised effect |
| Tested "more is better": six dose groups, continuous splines, doubling of dose among the active | ≥600 vs 150–299 min/wk: no difference (0.89, 0.59–1.34); per doubling: 0.97 (0.90–1.04) | Cannot rule out a smaller true gradient; self-report error flattens real gradients |
| Progressively removed reverse causation: dropped deaths in the first 12/24/48 months, excluded baseline disease and fair/poor self-rated health | The estimate moves one way throughout: 0.64 → 0.66 → 0.69 → 0.72 → 0.80 → 0.85 (the last two cross 1) | The remaining 0.85 could be a real effect, or unmeasured health differences |
| Compared three activity domains: leisure, work and chores, transport walking/cycling | Opposite social gradients, nearly identical hazard ratios (0.65 vs 0.70, difference p=0.48) | This questionnaire counts chores and yard work as "work", so it cannot test the occupational-activity controversy |
| Recomputed the published counts of the LIFE trial and confronted them with the observational magnitude | Mobility disability: −5.4 percentage points; deaths 48/818 vs 42/817 (risk ratio 1.14); an effect the size of 0.64 acting within the trial would predict about 35 (p=0.007) | Neither arm was inactive (the control arm averaged 153 device-measured minutes per week); with only 90 deaths the trial has 12% power for a 15% reduction, so it neither proves "no effect" nor directly refutes a benefit of going from nothing to something |
Scope: the strength, shape and credibility of the association between adult leisure physical activity and all-cause mortality, plus the functional outcomes that randomised exercise interventions have actually measured. No personal exercise prescriptions, no intensity or set recommendations, no conversion of hazard ratios into "years of life gained."
Data: who, measured how, followed for how long
NHANES is a nationally representative survey with a complex sampling design. We pooled the four cycles from 2007–2008 to 2013–2014, kept people aged 40–79 at interview who completed the physical examination and were eligible for mortality linkage, then required complete leisure activity reports and model covariates: 12,069 people, representing about 119 million US adults after weighting. The selection steps were 40,617 pooled participants → 13,999 aged 40–79 → 13,595 examined → 13,571 eligible for linkage → 13,558 with a complete activity report → 12,069 with complete covariates. The 11% lost at the last step were mostly missing the family income-to-poverty ratio; keeping them with missing indicators gives 0.59 (0.52–0.67), slightly stronger than the main estimate, so the complete-case rule did not manufacture the association. NHANES public data
Deaths come from the National Center for Health Statistics public-use linked mortality files, followed through 31 December 2019: 1,587 deaths, median follow-up 102.5 months (8.5 years), maximum 159 months. This public version is de-identified with some values perturbed, and is used according to the official documentation. Public-use linked mortality files
The activity questionnaire follows the WHO GPAQ and asks about each domain separately; the leisure questions explicitly say to exclude the work and transport activities already reported, so the three domains separate cleanly. Intensity conversion uses the metabolic equivalents given in the official documentation appendix: 8.0 for vigorous, 4.0 for moderate. The main exposure is guideline-equivalent minutes per week (moderate minutes + 2 × vigorous minutes), because it maps directly onto the 150–300 minute public health recommendation. The dose cut points come from the 2018 US guidelines and were not chosen from the data. NHANES physical activity questionnaire documentation2018 Physical Activity Guidelines
One fact worth holding onto: on this definition, 50.6% of US adults aged 40–79 report zero minutes of leisure-time moderate-to-vigorous activity per week. That zero is not a fringe group; it is half the population.
Before fitting anything, we recounted every frequency cell printed in the official codebooks: four cycles, 21 variables, 368 cells, all matching. That only proves the import and the special codes (refused, don't know, skipped) were handled correctly. It says nothing about whether respondents' reported minutes are accurate — a point we return to below. Reproduction package
Result 1: the step is at zero, not along the dose
Crude death rates fall with activity: 19.6 per 1,000 person-years in the zero group, 6.9 in the 600+ group. The two groups have similar mean ages (58.1 and 55.1 years), so this is not simply age.
The weighted Cox models give a sharper picture. With "no leisure exercise" as the reference, under three covariate sets:
| Leisure activity (guideline-equivalent min/wk) | n | Deaths | Demographic + socio-economic | + smoking, BMI | + baseline health |
|---|---|---|---|---|---|
| 0 (reference) | 6,865 | 1,140 | 1.00 | 1.00 | 1.00 |
| 1–74 | 815 | 84 | 0.60 (0.46–0.78) | 0.65 (0.50–0.84) | 0.69 (0.53–0.89) |
| 75–149 | 1,029 | 106 | 0.71 (0.56–0.89) | 0.75 (0.60–0.95) | 0.82 (0.65–1.03) |
| 150–299 | 1,313 | 102 | 0.51 (0.41–0.64) | 0.56 (0.45–0.70) | 0.61 (0.49–0.77) |
| 300–599 | 1,166 | 102 | 0.64 (0.51–0.80) | 0.71 (0.57–0.90) | 0.80 (0.64–1.01) |
| ≥600 | 881 | 53 | 0.45 (0.33–0.61) | 0.50 (0.37–0.68) | 0.59 (0.43–0.80) |
Collapsing the six groups into "any versus none" gives the number this article keeps returning to: hazard ratio 0.64 (0.56–0.72). Looking across groups, every active category sits clearly below the zero group, but they do not form an ordered ladder among themselves: 75–149 minutes is higher than 1–74, and 300–599 is higher than 150–299. Compared head to head, ≥600 versus 150–299 gives 0.89 (0.59–1.34) — no evidence of a difference. Among the active only, each doubling of dose gives 0.97 (0.90–1.04).
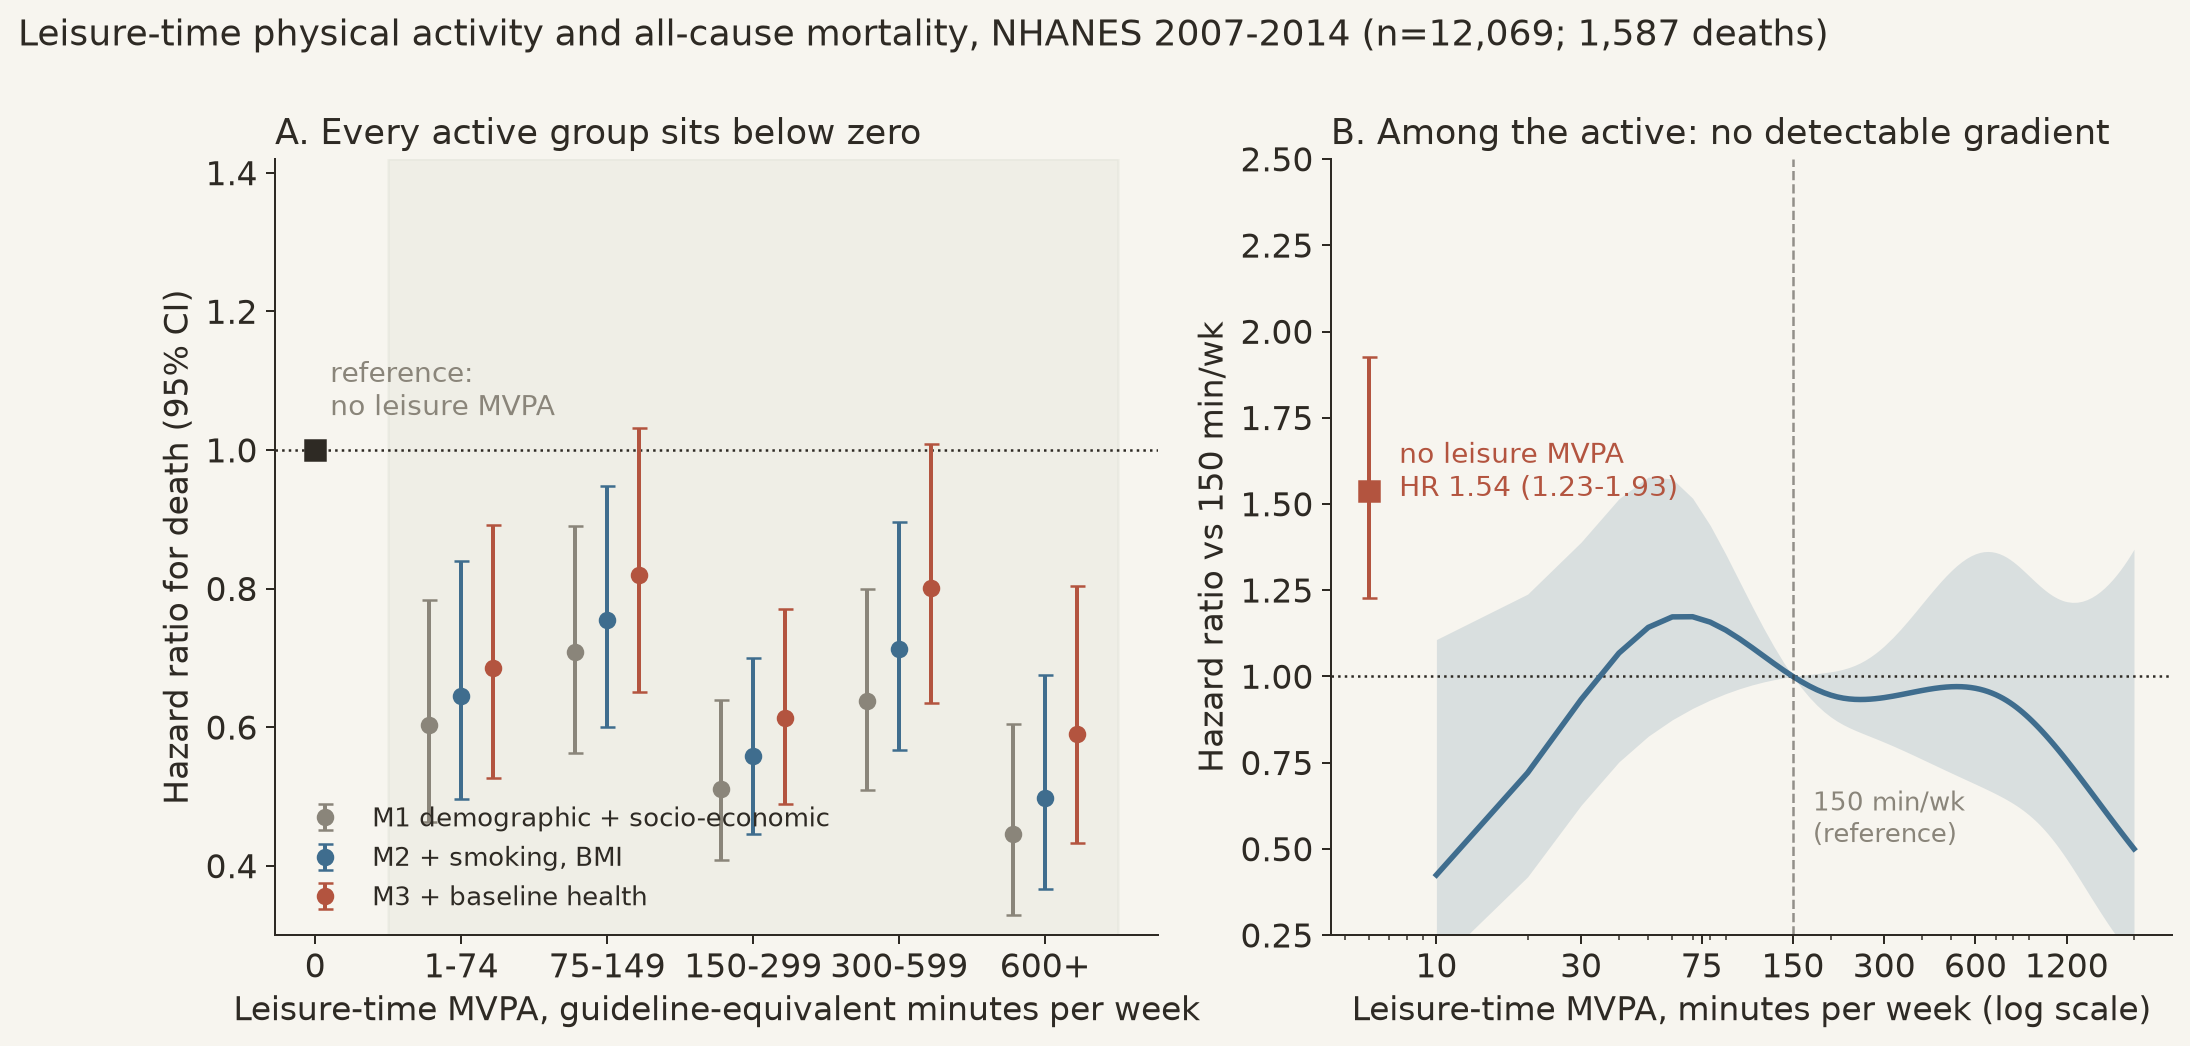
So these data support "moving versus not moving matters a lot," not "more is better." That matches a pooled analysis of 661,137 adults: meeting the guideline minimum captures close to the maximum associated benefit, a ceiling appears at 3–5 times the minimum, and 10+ times is no better (0.68, 0.59–0.78). Pooled cohort analysis A dose-response meta-analysis covering 94 cohorts and over 30 million participants finds the same shape: the risk differences concentrate between zero and roughly 150 minutes per week, with smaller and more uncertain differences above that. Dose-response meta-analysis
Result 2: every step that removes reverse causation moves the estimate toward 1
"Illness makes people inactive, then kills them" appears in data as "inactive people die more." That explanation has a testable signature: it should concentrate in early follow-up.
Splitting follow-up in two, the hazard ratio in the first five years is 0.48 (0.39–0.59), and after five years 0.76 (0.64–0.91); formally testing the difference gives a ratio of 1.60 (1.24–2.07), p=0.001. Proportional hazards genuinely does not hold here, so the single 0.64 is a weighted average over follow-up rather than a stable effect.
Following that thread through the pre-specified sensitivity analyses, every step moves the same way:
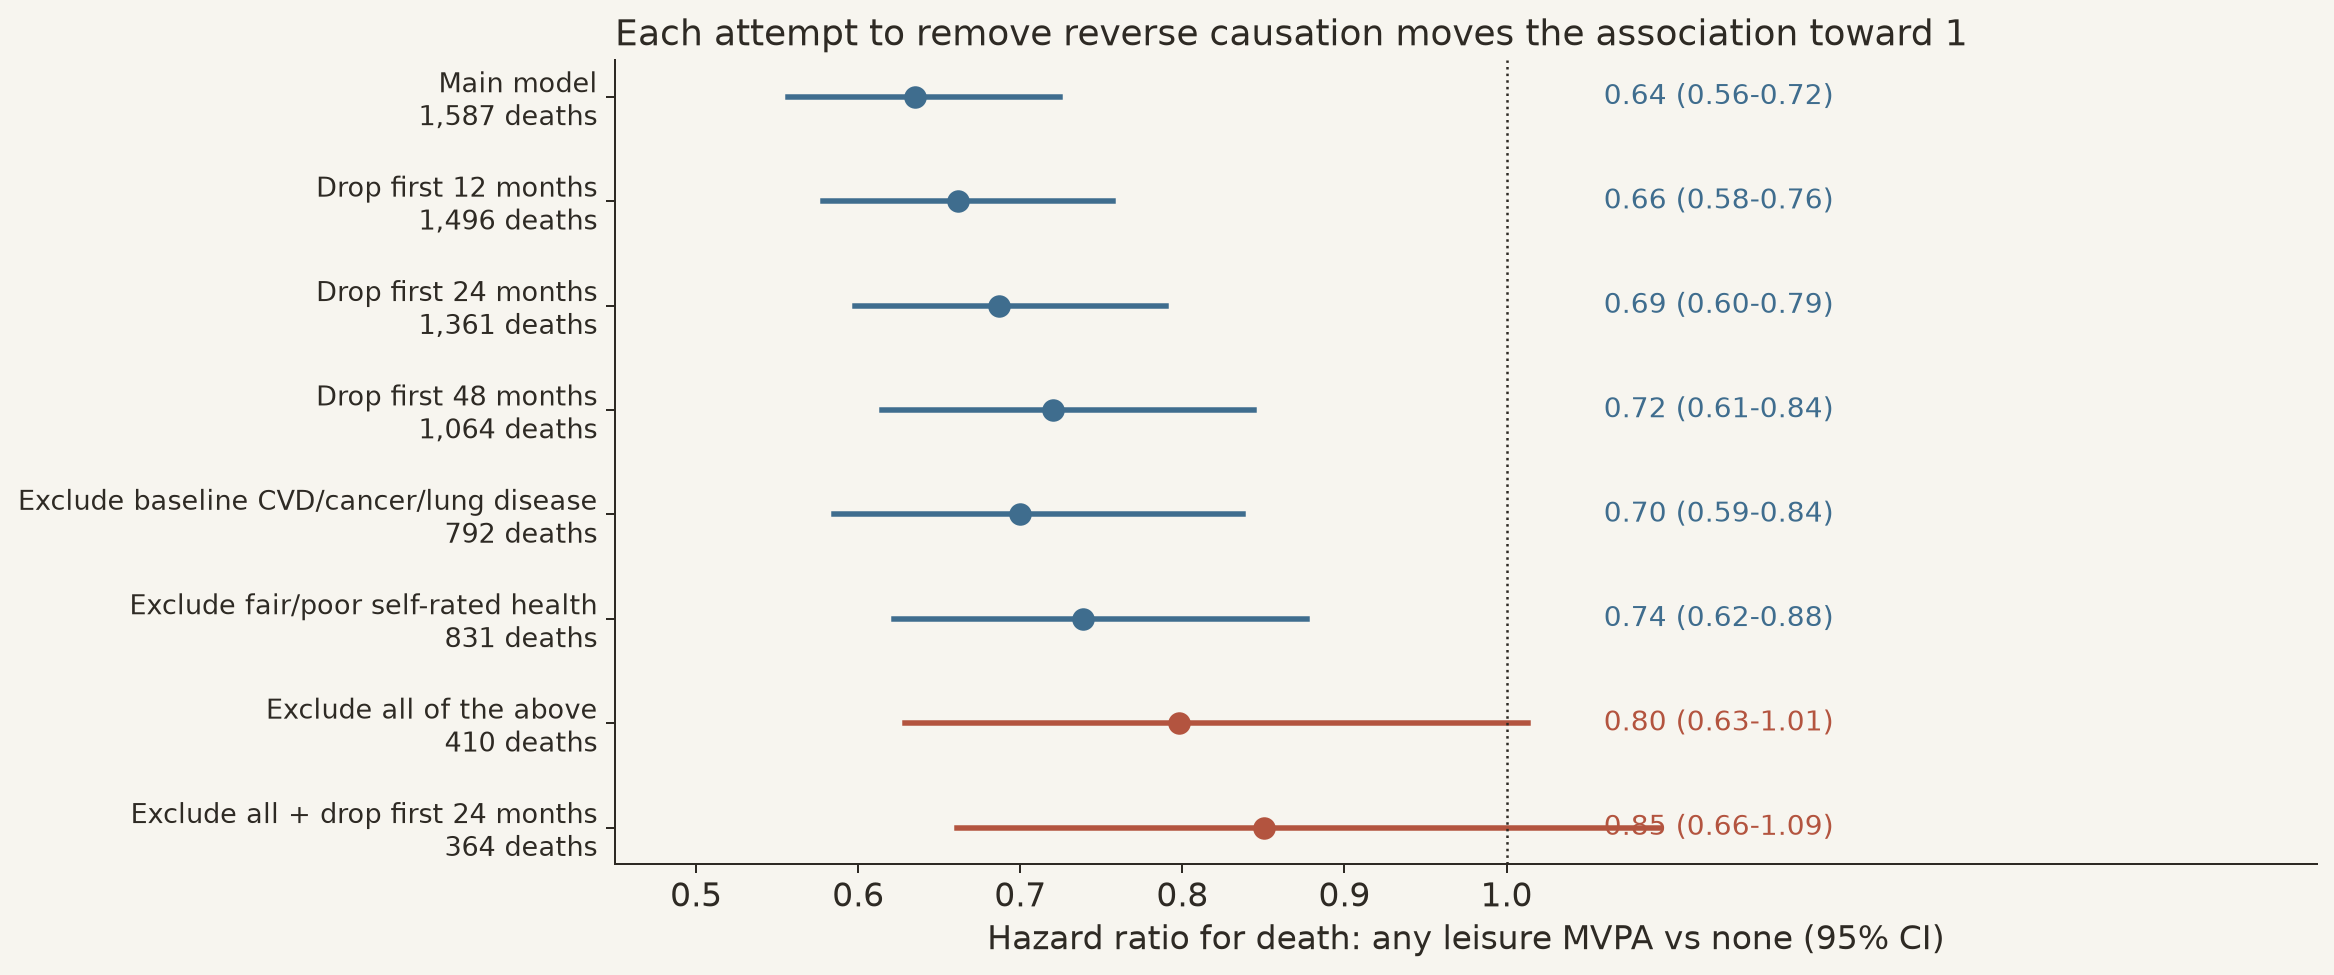
At the strictest setting — no self-reported cardiovascular disease, cancer, lung disease or diabetes at baseline, self-rated health not "fair or poor", and the first 24 months of deaths dropped — the hazard ratio is 0.85 (0.66–1.09), p=0.26.
Two things have to be said together here; saying either one alone is misleading. First, most of the association was removed: a large share of the "exercise cuts mortality by a third" figure in the observational literature can be explained by being able to move being a consequence of health. Second, the remaining 0.85 is not zero: only 364 deaths remain in that stratum and the lower bound is still 0.66; and putting self-rated health and prevalent disease into the model may itself block the pathway through which exercise would act, which is over-adjustment. The honest statement is: these data cannot separate "exercise makes people less likely to die" from "healthier people are more able to exercise"; what they can establish is that the first is much smaller than the headline number.
The same question can be asked in reverse: how strong would an unmeasured confounder have to be to explain the association away entirely? By the standard sensitivity calculation, moving 0.64 back to 1 requires an unmeasured factor associated with both activity and death by a factor of roughly 2.1 to 2.5, over and above the adjusted age, smoking, BMI and income. That threshold cuts both ways. It is not low: weak confounding cannot explain this association, and a vague appeal to "active people have better habits generally" does not suffice. But it is not out of reach either — the self-rated health we did measure is of exactly this magnitude: 30% of the inactive report fair or poor health versus 10% of the active, and self-rated health strongly predicts death. One more unmeasured health-status variable of similar strength would be enough, and the attenuation series above is evidence that such variables are at work.
A more technical check points the same way. We compared three statistical treatments. Using the survey design correctly gives 0.64 (0.56–0.72); ignoring weights and design entirely gives 0.67 (0.60–0.76); and using the weights while treating the 119 million weighted population as the real sample size gives 0.635 (0.634–0.636) — a confidence interval 0.002 wide. The point estimate barely moves, but the third result's precision is fake. This mistake is not rare in secondary analyses, and it is why the design details are spelled out in the reproduction package.
Result 3: sport, chores and commuting — opposite social gradients, the same hazard ratio
The other major competing explanation is socio-economic position: people who exercise tend to be more educated, richer and less likely to smoke, and those things predict survival on their own. Adjusting for them only handles the measured part.
There is a stronger test available: find another activity domain whose social gradient runs the other way. In the same questionnaire, the "work" domain asks about paid and unpaid work, household chores and yard work. Among adults aged 40–79, people who report this kind of activity are less educated (26% with a college degree versus 34% of those who do not report it) and smoke more (22% versus 18%), with identical incomes — the mirror image of the leisure exercisers (43% versus 18% college, 13% versus 26% smoking).
If the protective association were mainly confounding by advantage, a domain with the opposite gradient should not show the same association. It does: putting all three domains in one model gives leisure 0.65 (0.57–0.75), work and chores 0.70 (0.62–0.80), transport walking or cycling 0.87 (0.75–1.01); formally comparing leisure with work gives a ratio of 0.93 (0.76–1.14), p=0.48.
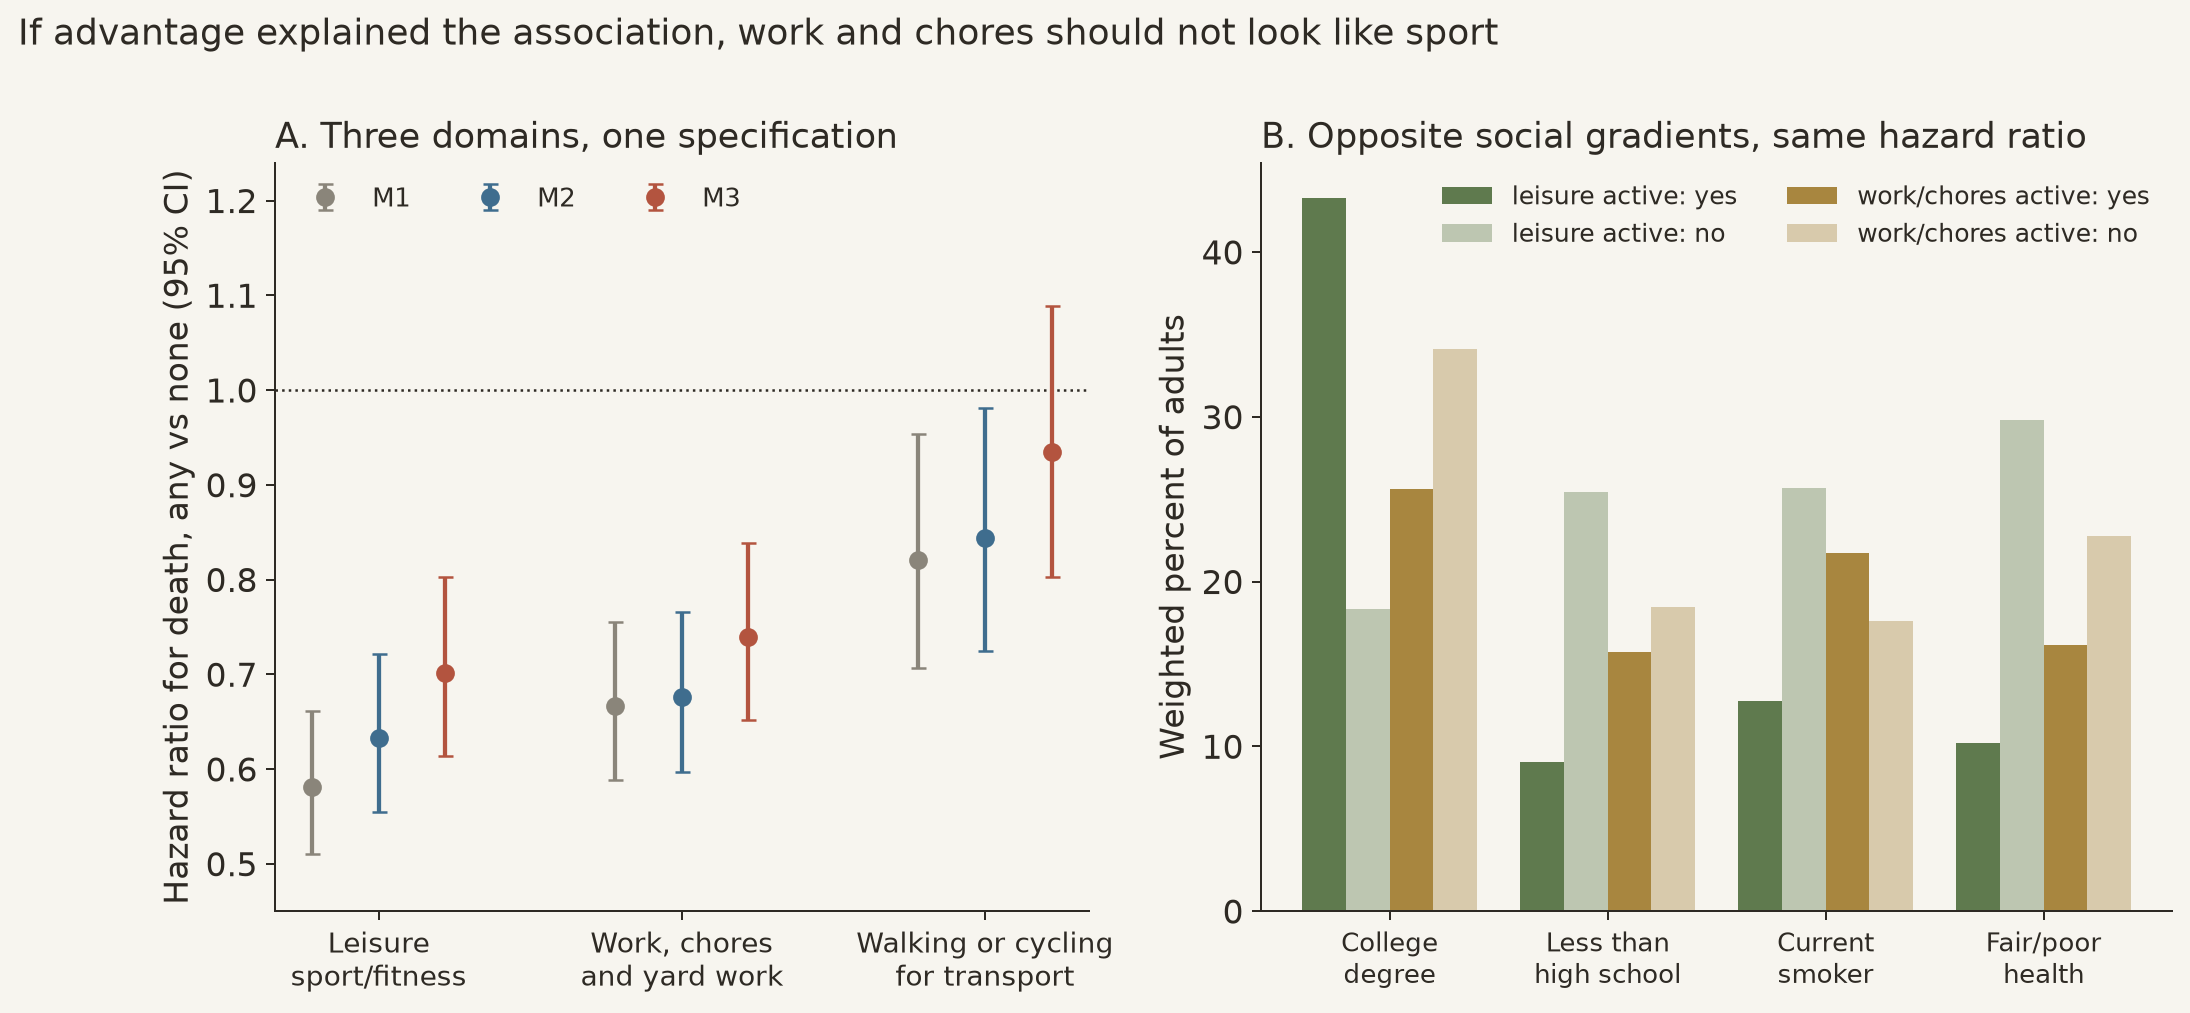
This weakens two explanations at once. It does not support "the association is mainly an artefact of social advantage," and it does not support "leisure exercise has some special longevity magic." What the three domains share is being able to do physical activity at all — which contains both the real physiological effect of moving and the state of still being well enough to move. These data cannot separate the two.
One further clue points toward a real effect. Split by cause of death (exploratory, with other causes censored), the association is strongest for heart disease (0.48, 0.35–0.65) and weakest for cancer, where it crosses 1 (0.80, 0.64–1.00). That specificity fits the mechanism through cardiorespiratory fitness. But it fits reverse causation equally well: heart failure and chronic lung disease both prevent movement and kill. Specificity here is evidence in both directions and cannot settle causation on its own.
A question people often ask: does it still help when you are older? Comparing those meeting 150 min/wk with those who do not, the hazard ratio is 0.66 (0.50–0.87) at ages 40–59 and 0.63 (0.53–0.74) at 60–79, interaction p=0.90 — no evidence of a difference by age. All the caveats above apply here too.
One limit must be stated plainly: because this item counts chores and yard work as "work", it cannot be used to test the controversy about occupational physical activity. A systematic review reports higher all-cause mortality among men with high occupational activity, but that compares high versus low occupational load, which is not the same as our any-versus-none contrast. Systematic review on the occupational activity paradox
What "minutes per week" actually measures
Every exposure number above comes from an interview question. The consequences are more serious than "a bit of noise."
The most direct evidence comes from the LIFE trial itself. Participants had to be sedentary to enrol (self-reporting less than 20 minutes per week of structured activity), and their baseline self-reported walking and strength training had a median of 0 to 30 minutes per week. The same people wearing accelerometers recorded a median of 153 to 161 minutes per week of moderate-intensity activity. LIFE randomised trial
In other words, a self-reported "zero" and a device-measured "over two hours a week" can belong to the same person. This is not simple under-reporting: self-report asks about deliberately taking exercise, while the device records the body moving. They are different quantities. Systematic review evidence likewise shows only moderate agreement between self-report and objective measurement, with biases that vary by age, weight and sex. Self-report versus objective measurement
That explains an apparent contradiction. A harmonised analysis of accelerometer cohorts puts the most active quarter against the least active quarter at 0.27 (0.23–0.32) — far stronger than the roughly 0.6 seen in every self-report study. Accelerometry pooled analysis
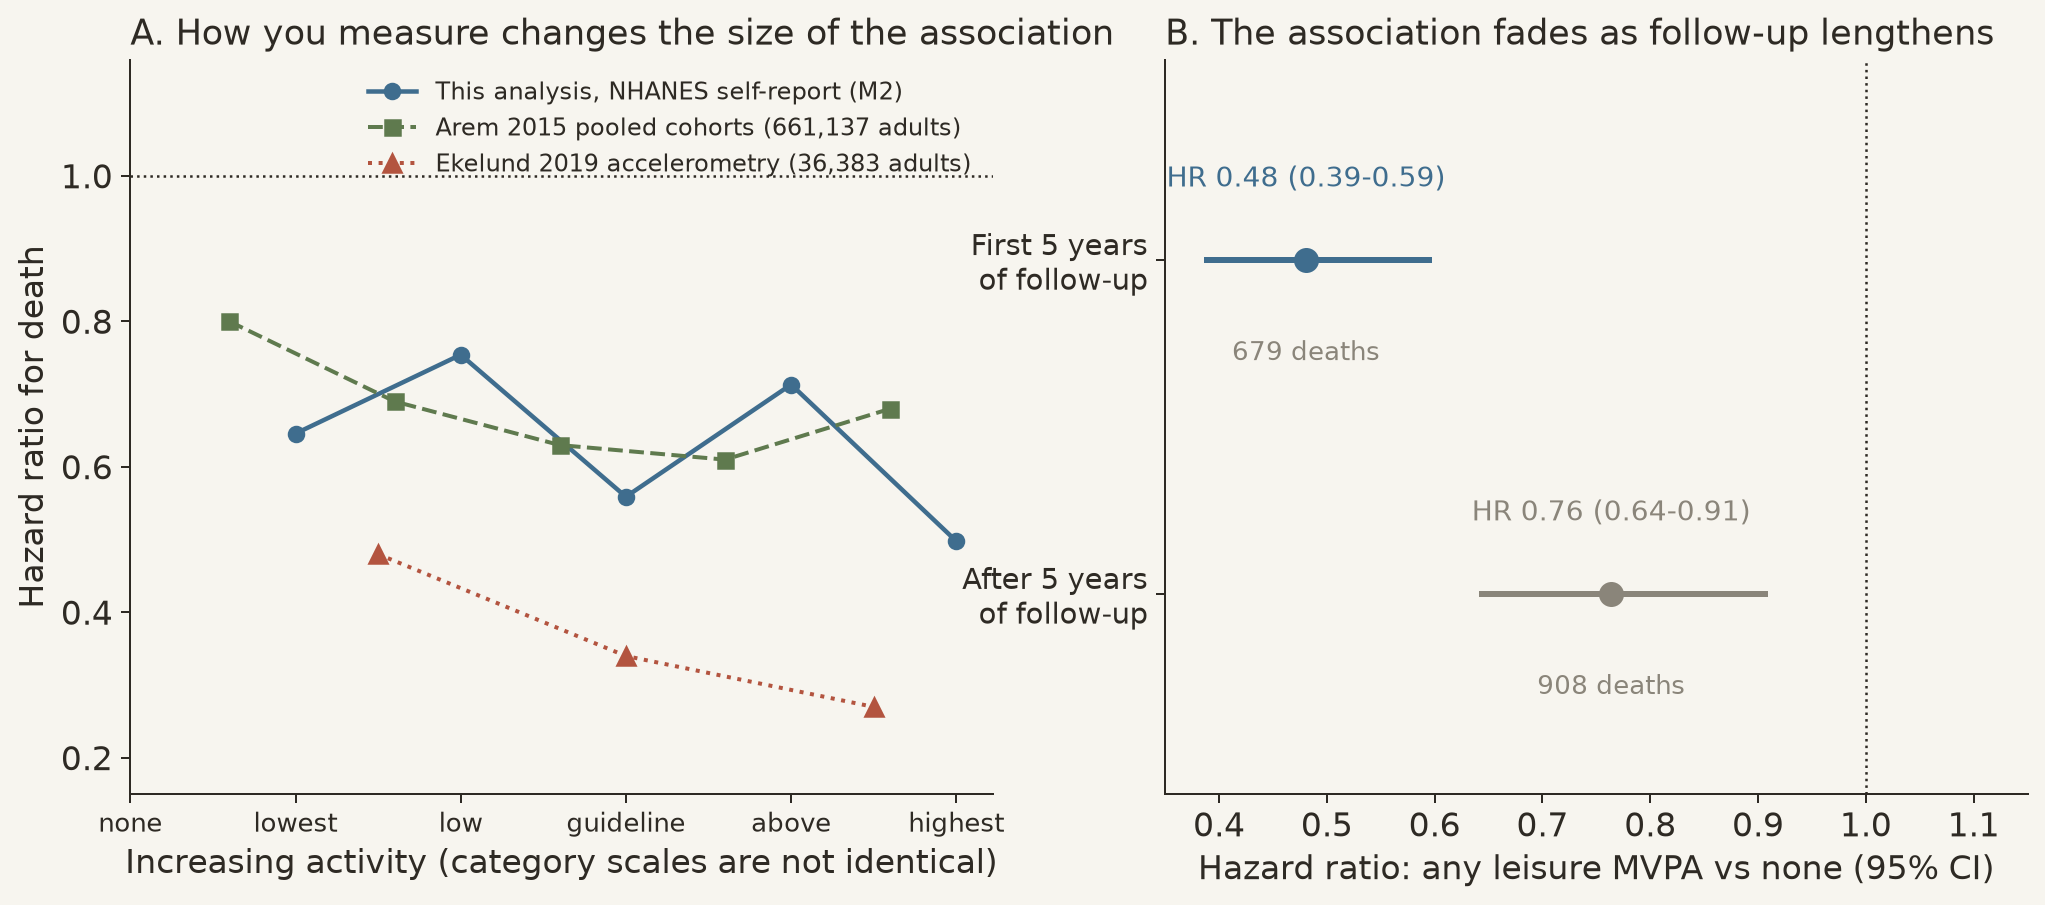
The stronger association is easily read as "see, the true effect is bigger and self-report dilutes it." That reading has a problem: devices measure total movement, which is exquisitely sensitive to current frailty, pain and cardiorespiratory capacity, and those accelerometer cohorts have a median follow-up of only 5.8 years — exactly the early window where we find the association at its strongest. Change the measurement and you change the quantity being estimated; a bigger number is not automatically stronger causal evidence.
The one long-term randomised trial: mobility improved, deaths did not
The only way around all of the above is to randomise. The LIFE trial assigned 1,635 adults aged 70–89 with existing physical limitation (Short Physical Performance Battery ≤9) but still able to walk 400 m to either a structured activity programme (walking-based, target 150 min/wk, plus strength, flexibility and balance training) or a health education comparator, with a mean follow-up of 2.6 years and outcomes assessed blind to assignment.
We recomputed each outcome from the counts printed in the paper:
| Outcome | Activity arm | Control arm | Risk difference (95% CI) |
|---|---|---|---|
| Major mobility disability (cannot walk 400 m) | 246/818 (30.1%) | 290/817 (35.5%) | −5.4 percentage points (−10.0 to −0.9) |
| Persistent mobility disability | 120/818 (14.7%) | 162/817 (19.8%) | −5.2 percentage points (−8.8 to −1.5) |
| Death | 48/818 (5.9%) | 42/817 (5.1%) | +0.7 percentage points (−1.5 to +2.9) |
| Any serious adverse event | 404/818 (49.4%) | 373/817 (45.7%) | +3.7 percentage points (−1.1 to +8.6) |
Our recomputed risk ratio for the primary outcome is 0.85, consistent in direction and magnitude with the published hazard ratio of 0.82 (the first compares the proportion of people with an event over 2.6 years, the second compares instantaneous hazards). The absolute difference of −5.4 percentage points means one case of mobility disability avoided for every 18 people taking part over two and a half years. This is the only causally interpretable evidence in this article, and it is about function, not lifespan.
Deaths went the other way (48 versus 42, risk ratio 1.14, 0.76–1.71). Serious adverse events and hospitalisations also leaned slightly toward the activity arm (risk ratios 1.08 and 1.10), none of them statistically significant. This should not be read as "exercise increases mortality or causes harm." What it does say is that in this frail older population, a supervised activity programme is not a zero-risk undertaking, and it showed no mortality benefit.
Putting the trial and the observational number face to face is worth doing carefully:
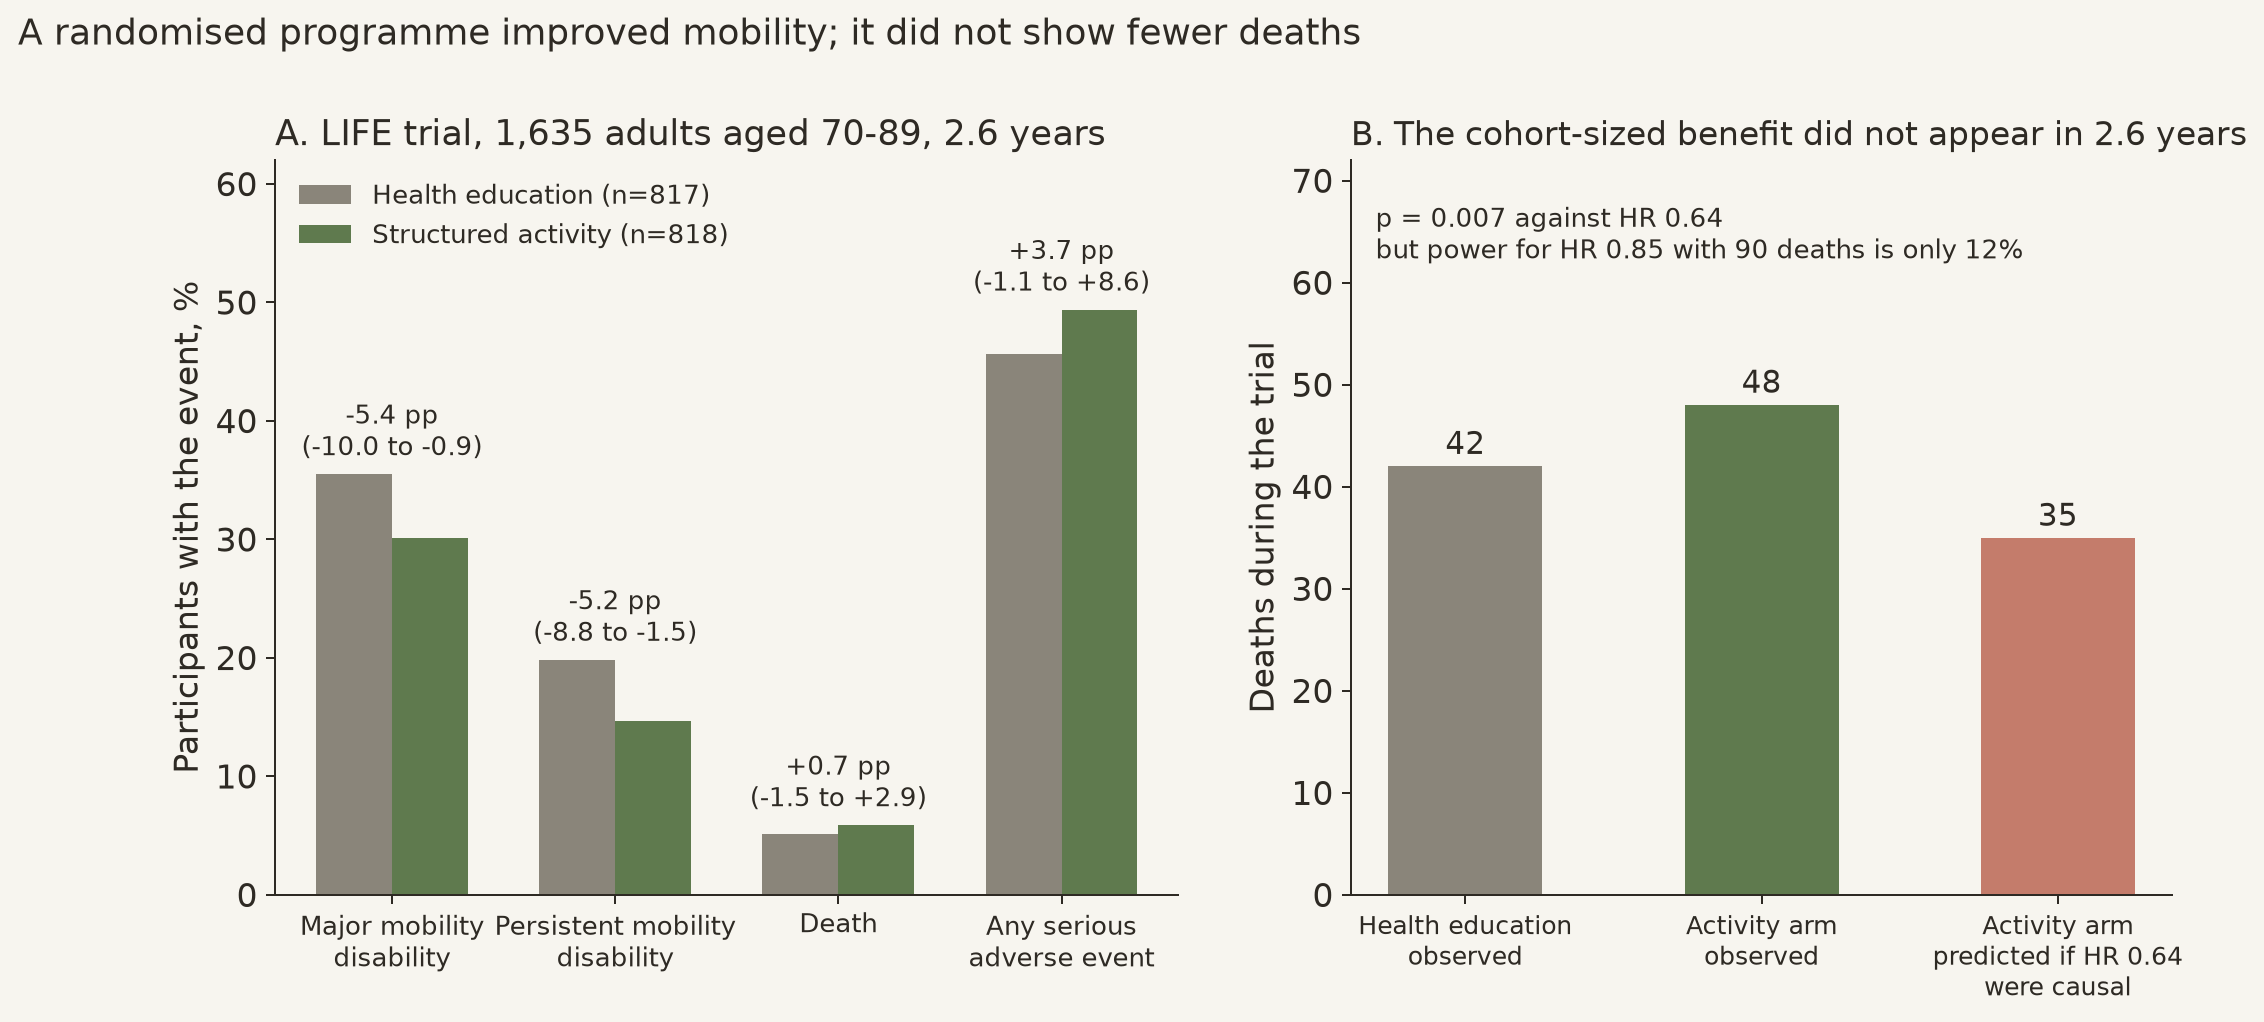
The trial had 90 deaths in total. If an effect of the size of 0.64 acted within two and a half years, the activity arm should have had about 35; it had 48, two-sided p=0.007. But what that test actually refutes has to be stated precisely, or it will be over-read.
First, neither arm was inactive. The control arm's baseline accelerometer median was 153 minutes per week of moderate activity; the intervention arm's was 161. Randomisation changed whether someone joined a structured walking and strength programme, not whether they moved at all. So the test refutes "adding a structured programme, on top of the substantial activity both arms already had, cuts deaths by a third within 2.6 years." It does not directly refute "people who do nothing would benefit from starting."
Second, it assumes the effect is immediate. If exercise acts on mortality over a decade-long timescale, seeing nothing in 2.6 years is exactly what one should expect. That assumption favours the test, so the p-value above should be treated as an optimistic bound rather than a verdict.
Third, the population and duration are narrow: frail adults aged 70–89, two and a half years, against an observational contrast of decades of habit in a general population. The two estimands differ and cannot be subtracted.
Conversely, the same data have almost no ability to detect a smaller effect: detecting a 15% mortality reduction with 80% power would need about 1,189 deaths, and 90 deaths give 12% power. So the trial neither supports a large mortality benefit nor demonstrates that there is none.
Four explanations, judged
| Explanation | Current judgement |
|---|---|
| Exercise itself lowers mortality through cardiorespiratory, metabolic and muscular pathways | Partly supported. Two domains with opposite social gradients give equally sized associations; the cause-of-death pattern leans cardiovascular; the trial confirms functional benefit. But these data cannot quantify this pathway's share, and the cause specificity fits reverse causation just as well |
| Reverse causation: disease and frailty prevent movement | A major contributor. The association weakens with follow-up (0.48 in the first five years, 0.76 after), and stacked exclusions shrink it to 0.85 with no remaining statistical support |
| Socio-economic and behavioural confounding | Present but not the main driver. Adjusting for smoking and BMI moves 0.58 to 0.64; the work/chores domain, with the opposite social gradient, still shows an equally sized association |
| Measurement definitions and selective citation | Ruled out at the computational level in this article (every codebook cell reproduced, sensitivity analyses consistent), but important at the level of how the literature is described: self-report and devices measure different quantities, different methods give results from 0.27 to 0.80, and the largest one tends to be the one that circulates. We did not test the literature for publication bias |
What holds up
Three layers, kept separate:
Function (strongest). Randomly assigned structured activity reduces mobility disability in older adults: about 5 percentage points absolute, one case per 18 participants, with blinded assessment. This is something that can be said to an individual directly.
Association (moderate, and much weaker than the headline). The link between doing any leisure exercise and lower mortality is robust across model specifications, both sexes, both age bands, and the two domains with opposite social gradients (leisure and work/chores; the transport domain is weaker and crosses 1). But its credible magnitude is not 0.64 — it lies somewhere between about 0.85 and 0.64, depending on whether you regard adjusting for baseline health as confounder control or over-adjustment.
Lifespan (does not hold). No randomised evidence shows that exercise extends life; the one long-term trial pointed the other way and was underpowered. Every "exercise adds X years" figure is an extrapolation from observational association, and the analysis here shows such extrapolations are systematically inflated.
The most useful sentence for an individual is not "exercise more and live longer" but: the benefit of exercise that randomised trials actually support is staying able to walk and look after yourself for longer; as an investment in lifespan, the evidence chain breaks at the last step.
What we know and what we do not
Known: half of middle-aged and older US adults report no leisure exercise at all; that zero is associated with higher mortality across many checks; a substantial part of the association reflects health status itself; among people who already exercise, these data detect no additional mortality benefit from more dose; randomised exercise improves mobility in older adults with a number needed to treat of about 18.
Unknown: how large the causal effect of exercise on mortality is — the observational evidence under the strictest setting gives 0.85 (0.66–1.09) and the only randomised evidence gives 1.14 (0.76–1.71), two intervals that overlap heavily and both include 1, so current evidence cannot locate it; what the dose-response shape is causally (self-report error is enough to flatten a real gradient); how much aerobic, resistance and balance training each contribute, which these data cannot distinguish at all; anything about people over 80 (the public files top-code age at 80); and how far any of this transfers beyond US adults.
Safety boundary: this article gives no exercise prescription. In the LIFE trial, serious adverse events and hospitalisations leaned slightly against the activity arm (risk ratios 1.08 and 1.10, neither significant), which suggests that activity programmes for older adults with existing functional limitation need supervision and gradual progression; people with cardiovascular disease, serious joint problems or a recent fall should start under professional guidance. That is an observation under study conditions, not individual advice.
Methods note, reproduction and updates
For readers of the previous edition, plainly: this updates the legacy report Exercise and anti-ageing: the best-evidenced prescription for longevity. The "🟢 strong evidence" rating at its head, the framing of exercise as "the best-evidenced prescription for longevity," and the claim that "meta-analyses and RCTs agree that regular exercise slows biological ageing" are retracted in this update and replaced by a layered statement: randomised evidence supports the function layer, not the lifespan layer. This update is also narrower than the original. Its three sections on "telomeres and epigenetic age," "sarcopenia and resistance training," and "brain ageing and cognition," together with the specific training advice under "how to train," fall outside this study's question and have not been checked by this library, so they are not carried over. Removing them is not a finding that those directions lack evidence; it means we have not examined them. This edition likewise offers no exercise prescription.
A single agent framed the question, built the data, ran the analysis, conducted the self-review and checked both language versions. This is not independent peer review, nor clinical professional review. The analysis plan — estimands, covariate sets, dose cut points and all sensitivity analyses — was written before any effect estimate was produced and is published with the reproduction package. Three deviations occurred during execution: the work domain's definition was corrected after reading the questionnaire (it includes chores, so it cannot test the occupational activity controversy), the proportional hazards test had to be replaced (the standard test fails under survey weights), and the quantification of unmeasured confounding was added after seeing the results. All three, with reasons, are recorded at the end of the plan, and exploratory analyses are labelled as such.
The downloadable package contains all code, input file fingerprints, the analysis plan and every output; the raw data are public files and can be re-downloaded and checked following the instructions inside. Third-party article originals are not redistributed; follow the citations.
Evidence cutoff 2026-09-18. Next scheduled review 2027-03-18. Earlier updates will be triggered by: the linked mortality files extending to a later follow-up year; a new large randomised exercise trial reporting mortality or healthspan outcomes; long-term follow-up of the LIFE trial; or important new evidence on the comparability of self-reported and device-measured activity.
Scope & limitations
- 暴露为一次性自报,且与设备测量不是同一个量:同一批人可以自报每周 0 分钟而设备记录每周 150 分钟以上,这既压平剂量梯度也使错分随随访时间增加。
- 观察层无法把「运动使人更不容易死」与「更健康的人更能运动」分开;最严格的排除后风险比 0.85(0.66-1.09)既容纳真实效应也容纳零效应。
- 把自评健康与既有病纳入模型同时构成混杂控制与过度调整,本数据不能判定哪一种解读正确。
- 分析人群限于 40-79 岁:公开文件将 80 岁及以上 topcode 为 80,本篇不覆盖最高龄人群。
- 完整病例分析排除了 11% 的合格参与者(多因家庭收入贫困比缺失);保留他们并用缺失指示变量得到 0.59,说明该规则未制造关联,但缺失机制未建模。
- 公开链接死亡档案经匿名化与部分扰动处理,个别记录的随访时间可能与真实值有差异;死因仅有 10 类汇总编码,本篇未做死因别主结论。
- 本数据的工作领域包含家务与院子活动,不能用于检验职业体力劳动与死亡的争议;相关系统综述只读到摘要层级。
- 随机证据仅一项试验(1,635 人、90 例死亡),人群为高危虚弱老人、随访 2.6 年、对照组接受健康教育;不能外推到健康中年人或无监督锻炼。
- 未区分有氧、抗阻、平衡训练各自的贡献;未使用 NHANES 自身的加速度计数据做同样本内的测量对照。
- LIFE 试验与各汇总分析均未取得个体数据,试验复算基于论文印出的计数;各汇总分析之间共享原始队列,不构成独立重复。
- 全部人体结果来自美国成人,跨人群外推需另行核对。
Sources
- National Health and Nutrition Examination Survey, public data files, cycles 2007-2008 through 2013-2014 (DEMO, PAQ, BMX, SMQ, MCQ, DIQ, HUQ)
dataset · Source version: public release files as downloaded 2026-09-18; SHA256 of all 28 .xpt files recorded
Reading scope
Full text
实际读入并分析全部 28 个数据文件;按官方码本逐格核对 368 个频数格全部一致(输出 A2_codebook_validation.csv)。留存的是完整文件指纹清单,原始数据为公开文件可按说明重新下载
- 2
- 8
- .
- x
- p
- t
- f
- i
- l
- e
- s
- a
- c
- r
- o
- s
- s
- f
- o
- u
- r
- c
- y
- c
- l
- e
- s
- ;
- v
- a
- r
- i
- a
- b
- l
- e
- s
- S
- E
- Q
- N
- ,
- R
- I
- D
- A
- G
- E
- Y
- R
- ,
- R
- I
- A
- G
- E
- N
- D
- R
- ,
- R
- I
- D
- R
- E
- T
- H
- 1
- ,
- D
- M
- D
- E
- D
- U
- C
- 2
- ,
- I
- N
- D
- F
- M
- P
- I
- R
- ,
- R
- I
- D
- S
- T
- A
- T
- R
- ,
- W
- T
- M
- E
- C
- 2
- Y
- R
- ,
- S
- D
- M
- V
- S
- T
- R
- A
- ,
- S
- D
- M
- V
- P
- S
- U
- ,
- P
- A
- Q
- 6
- 0
- 5
- -
- P
- A
- D
- 6
- 8
- 0
- ,
- B
- M
- X
- B
- M
- I
- ,
- S
- M
- Q
- 0
- 2
- 0
- /
- 0
- 4
- 0
- ,
- M
- C
- Q
- 1
- 6
- 0
- B
- /
- C
- /
- E
- /
- F
- /
- G
- ,
- M
- C
- Q
- 2
- 2
- 0
- ,
- D
- I
- Q
- 0
- 1
- 0
- ,
- H
- U
- Q
- 0
- 1
- 0
- NHANES Physical Activity Questionnaire documentation and codebooks (PAQ_E, PAQ_F, PAQ_G, PAQ_H), including Appendix 1 Suggested MET Scores
documentation · Source version: PAQ_E first published September 2009, last revised March 2017; PAQ_H as published for 2013-2014
Reading scope
Full text
逐节核读四个周期的题干、跳题逻辑、目标年龄、24 小时以上编辑规则与加权说明;MET 值 8.0/4.0/4.0 直接取自附录 1;确认休闲题干排除工作与交通、工作题干包含家务与院子活动
- C
- o
- m
- p
- o
- n
- e
- n
- t
- D
- e
- s
- c
- r
- i
- p
- t
- i
- o
- n
- ;
- E
- l
- i
- g
- i
- b
- l
- e
- S
- a
- m
- p
- l
- e
- ;
- I
- n
- t
- e
- r
- v
- i
- e
- w
- S
- e
- t
- t
- i
- n
- g
- a
- n
- d
- M
- o
- d
- e
- o
- f
- A
- d
- m
- i
- n
- i
- s
- t
- r
- a
- t
- i
- o
- n
- ;
- D
- a
- t
- a
- P
- r
- o
- c
- e
- s
- s
- i
- n
- g
- a
- n
- d
- E
- d
- i
- t
- i
- n
- g
- ;
- A
- n
- a
- l
- y
- t
- i
- c
- N
- o
- t
- e
- s
- ;
- A
- p
- p
- e
- n
- d
- i
- x
- 1
- S
- u
- g
- g
- e
- s
- t
- e
- d
- M
- E
- T
- S
- c
- o
- r
- e
- s
- ;
- c
- o
- d
- e
- b
- o
- o
- k
- b
- l
- o
- c
- k
- s
- f
- o
- r
- P
- A
- Q
- 6
- 0
- 5
- -
- P
- A
- D
- 6
- 8
- 0
- NCHS 2019 Public-Use Linked Mortality Files, NHANES 2007-2014 cycles
dataset · Source version: 2019 public-use release (follow-up through December 31, 2019), downloaded 2026-09-18
Reading scope
Full text
按官方读入程序的固定宽度布局逐字段解析并核对编码;实际用于全部 1,587 例死亡与随访时间;公开版本的匿名化与扰动说明已读并在限制中登记
- f
- o
- u
- r
- .
- d
- a
- t
- f
- i
- l
- e
- s
- (
- N
- H
- A
- N
- E
- S
- _
- 2
- 0
- 0
- 7
- _
- 2
- 0
- 0
- 8
- /
- 2
- 0
- 0
- 9
- _
- 2
- 0
- 1
- 0
- /
- 2
- 0
- 1
- 1
- _
- 2
- 0
- 1
- 2
- /
- 2
- 0
- 1
- 3
- _
- 2
- 0
- 1
- 4
- _
- M
- O
- R
- T
- _
- 2
- 0
- 1
- 9
- _
- P
- U
- B
- L
- I
- C
- .
- d
- a
- t
- )
- ;
- f
- i
- e
- l
- d
- s
- E
- L
- I
- G
- S
- T
- A
- T
- ,
- M
- O
- R
- T
- S
- T
- A
- T
- ,
- U
- C
- O
- D
- _
- L
- E
- A
- D
- I
- N
- G
- ,
- P
- E
- R
- M
- T
- H
- _
- I
- N
- T
- ,
- P
- E
- R
- M
- T
- H
- _
- E
- X
- M
- ;
- p
- u
- b
- l
- i
- c
- -
- u
- s
- e
- d
- o
- c
- u
- m
- e
- n
- t
- a
- t
- i
- o
- n
- p
- a
- g
- e
- Physical Activity Guidelines for Americans, 2nd edition
guideline · Source version: 2nd edition, 2018
Reading scope
Relevant sections
只读取成人有氧活动剂量建议与强度等效换算两处,用于预先固定分组切点与暴露口径;未审计其证据审议过程
- k
- e
- y
- g
- u
- i
- d
- e
- l
- i
- n
- e
- s
- f
- o
- r
- a
- d
- u
- l
- t
- s
- (
- 1
- 5
- 0
- -
- 3
- 0
- 0
- m
- i
- n
- u
- t
- e
- s
- /
- w
- e
- e
- k
- m
- o
- d
- e
- r
- a
- t
- e
- -
- i
- n
- t
- e
- n
- s
- i
- t
- y
- o
- r
- 7
- 5
- -
- 1
- 5
- 0
- m
- i
- n
- u
- t
- e
- s
- /
- w
- e
- e
- k
- v
- i
- g
- o
- r
- o
- u
- s
- -
- i
- n
- t
- e
- n
- s
- i
- t
- y
- )
- ;
- m
- o
- d
- e
- r
- a
- t
- e
- -
- t
- o
- -
- v
- i
- g
- o
- r
- o
- u
- s
- e
- q
- u
- i
- v
- a
- l
- e
- n
- c
- e
- Pahor M, et al. Effect of structured physical activity on prevention of major mobility disability in older adults: the LIFE Study randomized clinical trial
randomized_trial · Source version: JAMA 2014;311(23):2387-2396; NCT01072500; PMC author manuscript PMC4266388
Reading scope
Full text
逐节核读全文;复算了主要行动障碍、持续性行动障碍、死亡、严重不良事件与住院的风险、风险比、风险差与 NNT,与论文印出的风险比逐项对照;个体数据未取得
- S
- u
- m
- m
- a
- r
- y
- (
- D
- e
- s
- i
- g
- n
- ,
- I
- n
- t
- e
- r
- v
- e
- n
- t
- i
- o
- n
- s
- ,
- R
- e
- s
- u
- l
- t
- s
- )
- ;
- M
- e
- t
- h
- o
- d
- s
- (
- o
- u
- t
- c
- o
- m
- e
- d
- e
- f
- i
- n
- i
- t
- i
- o
- n
- ,
- c
- e
- n
- s
- o
- r
- i
- n
- g
- ,
- s
- t
- a
- t
- i
- s
- t
- i
- c
- a
- l
- c
- o
- n
- s
- i
- d
- e
- r
- a
- t
- i
- o
- n
- s
- )
- ;
- T
- a
- b
- l
- e
- 1
- b
- a
- s
- e
- l
- i
- n
- e
- s
- e
- l
- f
- -
- r
- e
- p
- o
- r
- t
- e
- d
- a
- n
- d
- a
- c
- c
- e
- l
- e
- r
- o
- m
- e
- t
- r
- y
- a
- c
- t
- i
- v
- i
- t
- y
- ;
- T
- a
- b
- l
- e
- 2
- a
- l
- l
- d
- e
- a
- t
- h
- s
- a
- n
- d
- a
- d
- v
- e
- r
- s
- e
- e
- v
- e
- n
- t
- s
- ;
- S
- a
- f
- e
- t
- y
- s
- e
- c
- t
- i
- o
- n
- Arem H, et al. Leisure time physical activity and mortality: a detailed pooled analysis of the dose-response relationship
pooled_cohort_analysis · Source version: JAMA Intern Med 2015;175(6):959-967; PMC4451435
Reading scope
Relevant sections
核读摘要与剂量分类结果段,取 0.80 / 0.69 / 0.63 / 0.61 / 0.68 五个分类风险比及 10 倍以上组的区间与异质性说明;补充表未逐项核对
- A
- b
- s
- t
- r
- a
- c
- t
- R
- e
- s
- u
- l
- t
- s
- ;
- R
- e
- s
- u
- l
- t
- s
- s
- e
- c
- t
- i
- o
- n
- o
- n
- M
- E
- T
- -
- h
- /
- w
- k
- c
- a
- t
- e
- g
- o
- r
- i
- e
- s
- i
- n
- c
- l
- u
- d
- i
- n
- g
- t
- h
- e
- 7
- 5
- +
- M
- E
- T
- -
- h
- /
- w
- k
- s
- t
- r
- a
- t
- u
- m
- a
- n
- d
- t
- h
- e
- 4
- 0
- -
- 7
- 5
- v
- s
- 7
- 5
- +
- c
- o
- m
- p
- a
- r
- i
- s
- o
- n
- Ekelund U, et al. Dose-response associations between accelerometry measured physical activity and sedentary time and all cause mortality: systematic review and harmonised meta-analysis
pooled_cohort_analysis · Source version: BMJ 2019;366:l4570; PMC6699591; PROSPERO CRD42018091808
Reading scope
Relevant sections
核读摘要与结果段,取四分位风险比 1.00 / 0.48 / 0.34 / 0.27 与样本、随访、事件数;用于说明测量方式改变估计对象,不用于支持更大的因果效应
- A
- b
- s
- t
- r
- a
- c
- t
- (
- R
- e
- s
- u
- l
- t
- s
- :
- e
- i
- g
- h
- t
- s
- t
- u
- d
- i
- e
- s
- ,
- n
- =
- 3
- 6
- ,
- 3
- 8
- 3
- ,
- m
- e
- d
- i
- a
- n
- f
- o
- l
- l
- o
- w
- -
- u
- p
- 5
- .
- 8
- y
- e
- a
- r
- s
- ,
- 2
- ,
- 1
- 4
- 9
- d
- e
- a
- t
- h
- s
- ,
- q
- u
- a
- r
- t
- e
- r
- -
- s
- p
- e
- c
- i
- f
- i
- c
- h
- a
- z
- a
- r
- d
- r
- a
- t
- i
- o
- s
- )
- ;
- C
- o
- n
- c
- l
- u
- s
- i
- o
- n
- Prince SA, et al. A comparison of direct versus self-report measures for assessing physical activity in adults: a systematic review
systematic_review · Source version: Int J Behav Nutr Phys Act 2008;5:56; PMC2588639
Reading scope
Relevant sections
核读摘要与主要结果,用于支持「自报与客观测量一致性只是中等且偏差与人群特征相关」这一条限定
- A
- b
- s
- t
- r
- a
- c
- t
- ;
- r
- e
- s
- u
- l
- t
- s
- o
- n
- c
- o
- r
- r
- e
- l
- a
- t
- i
- o
- n
- b
- e
- t
- w
- e
- e
- n
- s
- e
- l
- f
- -
- r
- e
- p
- o
- r
- t
- a
- n
- d
- d
- i
- r
- e
- c
- t
- m
- e
- a
- s
- u
- r
- e
- s
- a
- n
- d
- o
- n
- t
- h
- e
- d
- i
- r
- e
- c
- t
- i
- o
- n
- o
- f
- o
- v
- e
- r
- -
- a
- n
- d
- u
- n
- d
- e
- r
- -
- r
- e
- p
- o
- r
- t
- i
- n
- g
- Garcia L, et al. Non-occupational physical activity and risk of cardiovascular disease, cancer and mortality outcomes: a dose-response meta-analysis of large prospective studies
meta_analysis · Source version: Br J Sports Med 2023;57(15):979-989; PMC10423495
Reading scope
Relevant sections
核读摘要与结论,取剂量反应形状与 8.75 mMET-小时/周处的风险比;用于外部对照本篇「差异集中在低剂量段」的形状结论
- A
- b
- s
- t
- r
- a
- c
- t
- R
- e
- s
- u
- l
- t
- s
- (
- 9
- 4
- c
- o
- h
- o
- r
- t
- s
- ,
- >
- 3
- 0
- m
- i
- l
- l
- i
- o
- n
- p
- a
- r
- t
- i
- c
- i
- p
- a
- n
- t
- s
- ;
- m
- a
- r
- g
- i
- n
- a
- l
- d
- i
- f
- f
- e
- r
- e
- n
- c
- e
- s
- b
- e
- l
- o
- w
- a
- n
- d
- a
- b
- o
- v
- e
- 8
- .
- 7
- 5
- m
- M
- E
- T
- -
- h
- o
- u
- r
- s
- /
- w
- e
- e
- k
- ;
- a
- l
- l
- -
- c
- a
- u
- s
- e
- m
- o
- r
- t
- a
- l
- i
- t
- y
- R
- R
- 0
- .
- 6
- 9
- a
- t
- 8
- .
- 7
- 5
- m
- M
- E
- T
- -
- h
- o
- u
- r
- s
- /
- w
- e
- e
- k
- )
- Coenen P, et al. Do highly physically active workers die early? A systematic review with meta-analysis of data from 193,696 participants
systematic_review · Source version: Br J Sports Med 2018;52(20):1320-1326
Reading scope
Abstract
非开放获取,仅取得题录与完整摘要(本地 meta-coenen2018.json);用于说明本数据的工作领域含家务与院子活动、不能检验职业体力劳动悖论。未读全文,不作为承重主张来源
Authorship & review
Author self-review · Claude (AI agent)
2026-09-18 · 修订后复评,覆盖当前中文稿、英文稿、研究记录、分析计划与五张图。逐项核对首次自审列出的八个问题是否已处理,并重新核对全部承重数字与输出文件的一致性。评分 9.0/10。 2026-09-18 重新绑定到增补旧站交代段落后的版本:该段是编辑性说明,不含新的研究结论、数字或限定语,其对旧稿第 75 篇内容(强证据评级、处方定性、三节主题与训练建议)的描述已逐项对照读回原文核准,因此本条 9.0/10 的评分与所列发现继续适用于当前稿件。
Remaining limitations:
- 机制层缺少本数据的中间变量分析;若后续纳入 NHANES 的心肺适能或炎症标志物可补。
- 未做多重插补与竞争风险累积发生率,两者都不改变主结论方向但会影响精度表述。
- 复算环境未锁定包版本,跨机器重跑可能出现小数位差异。
- 英文稿没有独立第二方核对。
- 线上发布与旧站第 75 篇的原位更新尚未执行。
Editorial approval · Claude (AI agent)
2026-09-18 · 编辑签发由本篇作者同一 agent 执行,明示为同一人的不同工作角色,不冒称独立审阅,也不等于人类或临床专业审阅。按阻止公开清单逐项核对:来源身份与版本无误(LIFE 为 JAMA 2014 作者稿 PMC4266388,NCT01072500);无与原文相反的结论(LIFE 的行动障碍获益与死亡无获益均按原文方向表述);分母与统计对象正确(分组人数、事件数、加权百分比与设计校正区间逐项对过输出文件);未用模型假设证明现实(E-value 与功效计算均标注为解释性,不作为独立证据);安全缺口未被隐去(不良事件与住院的不利方向如实写出,虽均不显著);公开范围为证据描述,不含用药、剂量或特殊人群的可执行方案,因此不触发专业审阅要求。 本条覆盖英文正文当前版本,并确认其否定、比较方向、单位、区间与限定语与中文及主记录一致,未出现比中文更强的表述。 2026-09-18 二次签发:两语正文各增一段给旧站读者的交代,说明撤回旧稿的「🟢 强证据」评级与「证据最充分的长寿处方」定性,并说明本次更新的范围比旧稿窄——旧稿的端粒与表观遗传年龄、肌少症与抗阻训练、脑老化与认知三节及其运动处方建议未经本库复核,不在本版保留,且明写撤下不等于判定这些方向没有证据。该段所述旧稿内容已对照 evidence 中读回的第 75 篇原文逐项核准;增补未改动任何研究结论、数字或限定语。
Translation check · Claude (AI agent)
· 同一 agent 以同一证据记录独立撰写英文稿并逐段与中文对照:核对每个数字、每条限定、三层结论的强度与图注是否一致,确认英文未出现比中文更强的表述。这不是独立第二方语言核对。 2026-09-18 二次签发:两语正文各增一段给旧站读者的交代,说明撤回旧稿的「🟢 强证据」评级与「证据最充分的长寿处方」定性,并说明本次更新的范围比旧稿窄——旧稿的端粒与表观遗传年龄、肌少症与抗阻训练、脑老化与认知三节及其运动处方建议未经本库复核,不在本版保留,且明写撤下不等于判定这些方向没有证据。该段所述旧稿内容已对照 evidence 中读回的第 75 篇原文逐项核准;增补未改动任何研究结论、数字或限定语。
Funding & interests
本库为独立研究项目,无商业利益;与所引论文作者、期刊、数据仓库维护者及任何健身或医疗机构无关系。
Funding of cited research
无外部资助。