What we found
Among 8,977 adults aged 60 or older, each 0.1 higher FI was associated with an approximately 39% higher mortality hazard: HR 1.39, 95% CI 1.35–1.43. Both the total and its composition carried information. When compared on the same contribution-to-total-FI scale, functional, disease and other deficits had unequal associations. Removing five cardiovascular disease items left a clear association, HR 1.34 (1.30–1.37); those items do not account for the entire predictive signal. Temporal validation showed useful risk ranking but imperfect five-year absolute-risk calibration. These results support FI as a summary of health burden, not yet as a measure of aging rate or an individual lifespan predictor.
Correction, September 19, 2026: The original cardiovascular-item deletion analysis mismatched participant rows. Its HR of 0.98 and claim that prediction disappeared have been withdrawn. We also corrected functional-questionnaire special codes, depression missingness, survey standard errors, the denominator used in domain comparisons, and omission of sex when applying the development model. All results were recomputed. The previous claims of equal domain coefficients and good ten-year calibration no longer stand. The text and downloads below contain the corrected analysis.
| Question | What the analysis found | What it supports |
|---|---|---|
| Do more deficits accompany higher risk? | 3,083 deaths; HR 1.39 per 0.1 FI | An observational association, not the treatment effect of reducing FI by 0.1 |
| Does the same total mean the same risk? | Within intermediate score bands, a majority of functional deficits accompanied lower risk; equality of contributions on a common scale was rejected | A total score discards some prognostic information, without identifying which domain an individual should treat |
| Does the association depend entirely on cardiovascular items? | After removing heart failure, coronary disease, angina, myocardial infarction and stroke, the 35-item FI had HR 1.34 | Other items retain information; different index denominators prevent interpreting the HR difference as a fraction of risk explained |
| Does the model carry over to later cycles? | Five-year C-indices were approximately 0.78–0.82; predicted and observed probabilities differed | Risk ranking carried over reasonably well, but absolute probabilities still require calibration and external validation |
How a score summarizes health burden
Searle and colleagues' construction procedure specifies eligible deficits: they should relate to health, generally increase with age, avoid early saturation and cover multiple systems. It does not imply that an arbitrary collection of questions produces a valid index. A sufficiently large, appropriately chosen set can yield a stable summary without making every deficit clinically or prognostically equivalent. Searle 2008
Our fixed set comprises 20 functional difficulties, 14 disease-history items, and six other items: self-rated health, overnight hospitalization in the preceding year, depression screening, underweight, severe obesity and unintentional weight loss. Kidney problems belong to the disease domain; managing money is included in the functional domain. The item list, variables and missingness are available in A1_items.csv. This is a new exploratory index, not an exact reproduction of a previously validated FI. Functional questionnaire Related variables
FI is the sum of deficit scores divided by the number of nonmissing items, requiring at least 30 of 40. Borderline diabetes scores 0.5; most other items are binary. Several coding decisions matter:
- Some difficulty, much difficulty and inability count as functional deficits. “Do not do this activity” is not proof of difficulty and remains unknown. People who skip the walking and stair questions because their walking-equipment screen is positive contribute an established mobility deficit in the main analysis; the higher-severity sensitivity analysis does not infer how severe that difficulty is.
- For participants under 60, skipped functional questions become zero only when the screening responses explicitly establish a negative screen and the item was actually skipped. Missing answers do not all become zero. The main analysis remains restricted to age 60 or older.
- PHQ-9 requires all nine responses. Refusals, unknown responses and nonresponse remain missing rather than becoming absent symptoms. The weight-loss item combines reported weight a year earlier, measured current weight and reported intent, so differences between measurement methods can affect it.
- Public age ceilings vary across cycles. We harmonized them to 80+, rather than treating 80–84 and 85+ as comparable observed groups throughout. Actual age variation within 80+ cannot be fully adjusted for.
Not every selected item meets the ideal construction criteria in this sample. Several disease items and severe obesity do not rise with age, while depression and weight-loss items have substantial missingness. We therefore retain the exploratory designation; a familiar-looking score distribution is not proof of validation.
Starting with 50,965 survey records, 9,429 participants were 60+, 9,415 were eligible for mortality linkage, and 9,382 had enough items to calculate FI. Requiring valid examination weights and follow-up left 8,977 participants. Mortality follow-up ended in 2019, with a median of 97.5 months. Pooled analyses used MEC weights divided by five and accounted for survey strata and PSUs; confidence intervals and P values use the same design-based covariance. Some follow-up times and causes of death in the public mortality files are perturbed for confidentiality; these files are not an untouched copy of the complete registry. Mortality linkage Weighting
The total has a clear association with risk
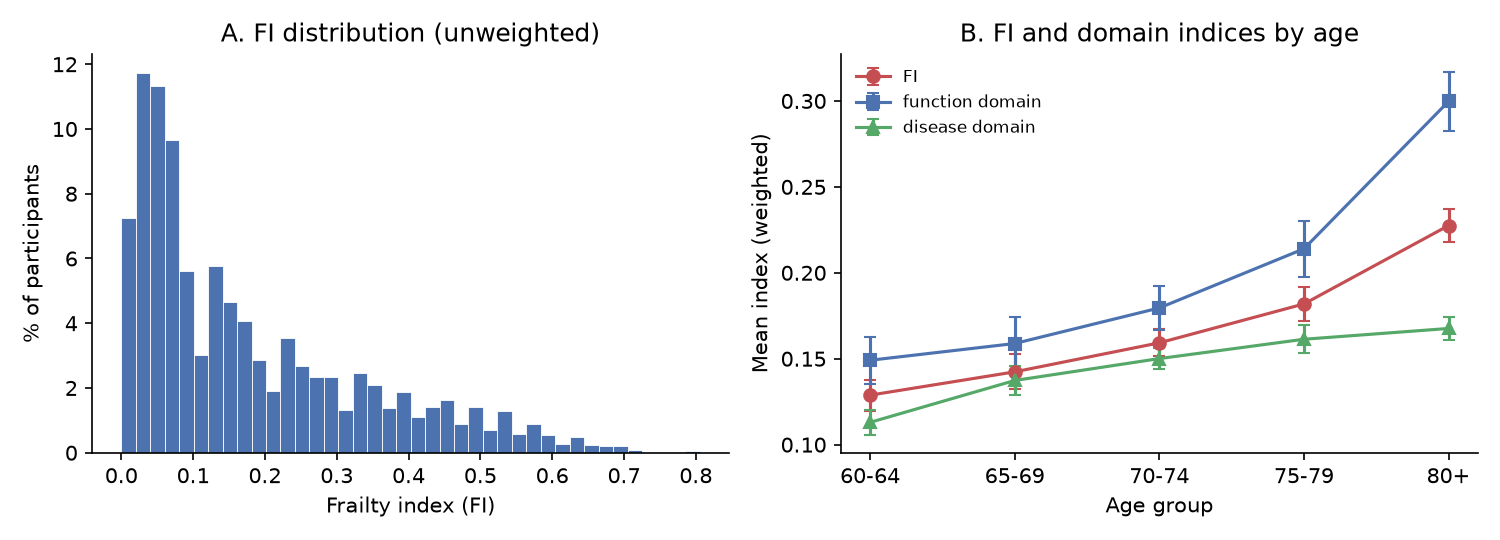
The weighted FI mean was 0.162, the median 0.103 and the 99th percentile 0.625. Its distribution had a long right tail. Mean FI was approximately 0.129 at ages 60–64 and 0.228 in the 80+ group. These are comparisons between different people, not trajectories showing how one person accumulates deficits.
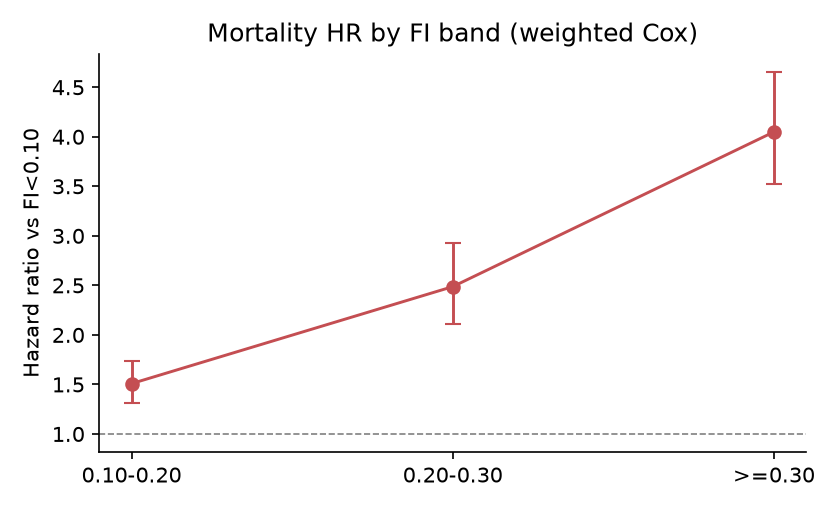
After adjustment for age, sex and survey cycle, each 0.1 higher FI had HR 1.39 (1.35–1.43). Relative to FI below 0.10, the 0.10–0.20, 0.20–0.30 and at-least-0.30 groups had HRs of 1.51, 2.49 and 4.05. Hazard ratios describe relative instantaneous event rates during follow-up, not ratios of mortality probabilities at a fixed time. An additional five-year interaction diagnostic shows that the FI association weakens over follow-up (interaction p approximately 8.3 × 10⁻⁸): HR 1.47 (1.42–1.51) per 0.1 in the first five years and 1.32 (1.27–1.36) thereafter. The overall 1.39 is therefore a model summary across follow-up, not a constant risk ratio at every time.
When fitted and evaluated in the full sample, the age, sex and cycle model had a weighted C-index of approximately 0.730, rising to 0.777 after adding FI. This is apparent discrimination and may be optimistic. It does not replace temporal validation or validate an individual's lifespan forecast. Blodgett and colleagues also linked self-reported and laboratory-based deficit accumulation to mortality in NHANES, using different items, ages and missingness rules. Blodgett 2017
Composition can matter at the same total
Units must be aligned before comparing domains. The function, disease and other domains contain 20, 14 and six items respectively: an increase of 0.1 in each domain's own proportion represents a different number of deficits. The corrected comparison uses each domain's deficit sum divided by the total number of observed items. These three contributions add exactly to total FI.
With all three contributions in the same model, adjusted for age, sex and cycle, HRs per 0.1 total-FI unit contributed by function, disease and other items were respectively 1.26 (1.21–1.30), 1.50 (1.32–1.70) and 3.00 (2.44–3.67). Equality of these linear coefficients was rejected: chi-square 93.28, 2 degrees of freedom, p approximately 5.6 × 10⁻²¹. The other domain has only six items, so a 0.1 contribution to total FI represents a substantial change within it. The common scale facilitates comparison; it does not imply that a domain can be manipulated independently in practice.
We also restricted total FI to three overlapping bands: 0.10–0.20, 0.15–0.25 and 0.20–0.30. Comparing people whose functional items accounted for more than half of their deficit sum with those at or below half, and adjusting for FI, age, sex and cycle, gave HRs of 0.82 (0.68–0.99), 0.68 (0.56–0.82) and 0.64 (0.51–0.80). Holm-adjusted P values for these three comparisons were approximately 0.035, 0.00018 and 0.00018. The reference is nonfunction-led, encompassing disease and other deficits; “disease-led” was an inaccurate label. Overlapping bands are not independent replications.
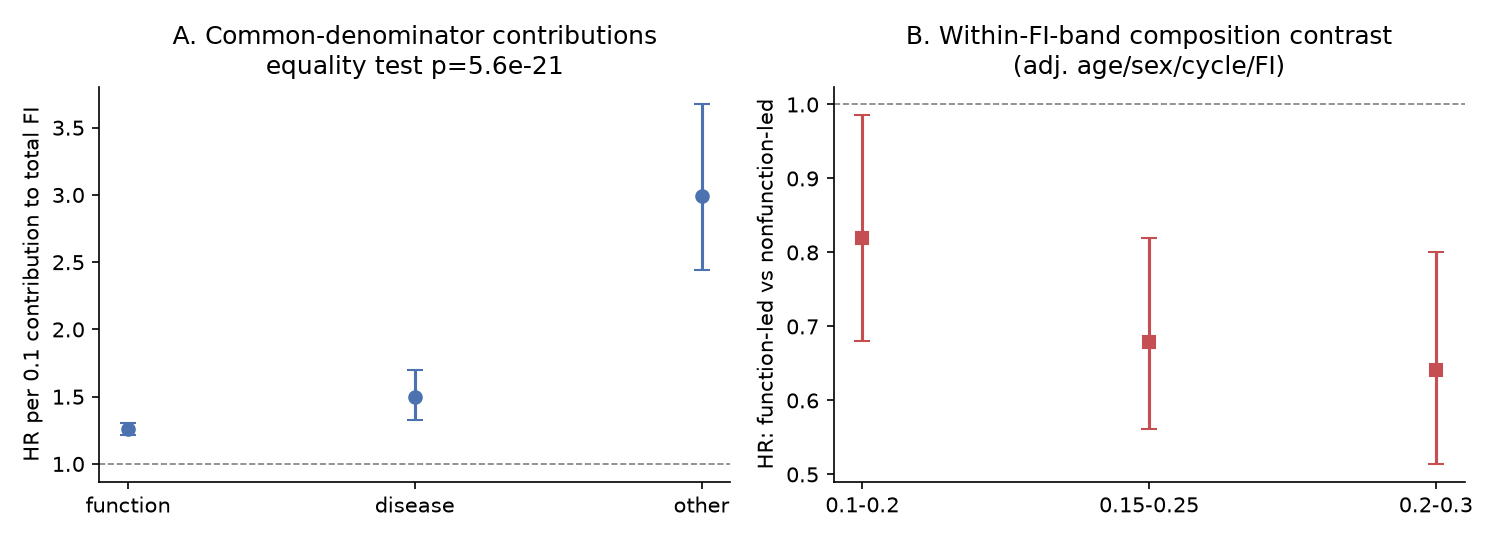
Across the entire sample with nonzero FI, a continuous functional-share term had HR 0.84 per full share unit, 95% CI 0.69–1.04, p=0.11. A simple linear composition effect over the whole range remains imprecise. Significant intermediate-band findings cannot establish the same pattern at every score. Conditioning on a total jointly determined by several deficits also induces statistical dependencies. These comparisons do not mean that replacing disease with disability would make someone safer.
A separate NHANES study by Quach and colleagues asked how much predictive performance changes when different sets of candidate items are combined. With sufficiently many items, different composite scores performed similarly, while retaining individual items preserved more predictive information. That question is related to, but distinct from, whether people with the same score are interchangeable. Neither analysis proves the other's proposition. Quach 2026
Removing cardiovascular items leaves an association
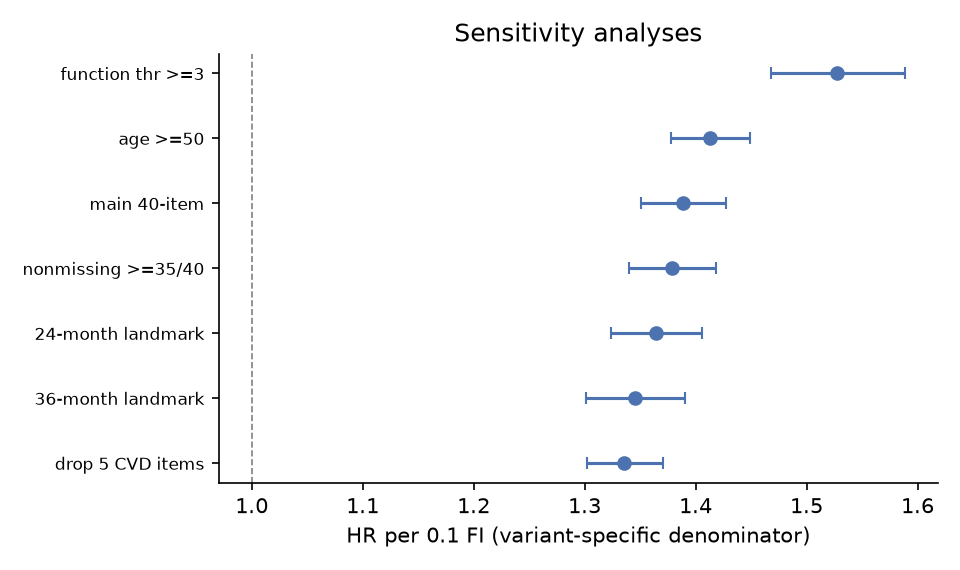
After correctly matching deficits by participant identifier, removing heart failure, coronary disease, angina, myocardial infarction and stroke left a 35-item FI with HR 1.34 (1.30–1.37) per 0.1. The previous estimate of 0.98 came from assigning rows of the full-survey deficit matrix to a filtered analysis sample by position. It was not a valid sensitivity result.
Other variants also retained an association: HR 1.38 when requiring at least 35 of 40 items; 1.36 and 1.35 in two- and three-year landmark analyses restricted to those still at risk, with follow-up restarted at the landmark; 1.41 when expanding to age 50+; and 1.53 when the functional threshold required much difficulty or inability. Rules change the scale and sometimes the sample. A larger HR alone does not identify a better index.
Risk ranking carries over better than absolute probabilities
Model coefficients were estimated only in the 2005–2008 cycles, using age, sex and FI. The complete coefficient vector, including sex, was then applied to 2009–2014. Coding rules were fixed, but this is a retrospective temporal split within the reanalysis, not a prospectively registered independent validation.
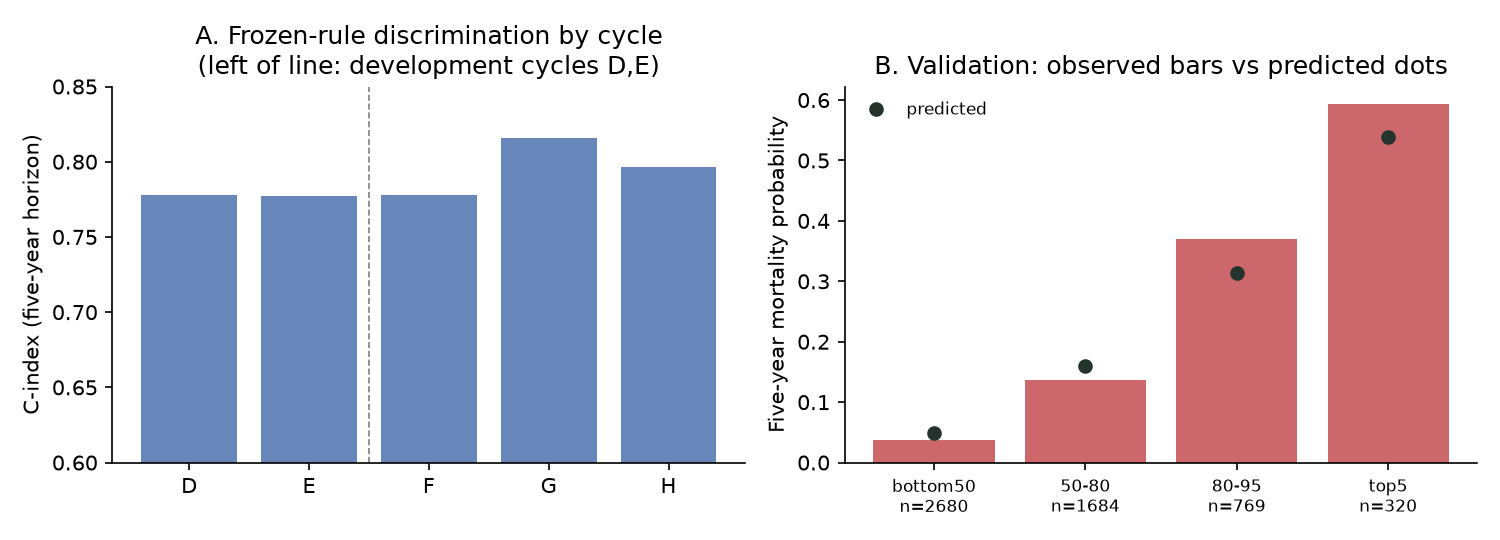
We used the first five years in every cycle. Later recruits do not all have ten years of follow-up, so a shared five-year horizon is more comparable. Weighted C-indices were 0.778 and 0.778 in development, and 0.778, 0.816 and 0.796 in validation. These are weighted ranking point estimates without a full survey-resampling uncertainty analysis; the differences do not show that predictive ability improved over calendar time.
Calibration requires comparing predicted probabilities with observed probabilities. A monotonic series of observed event rates alone demonstrates separation, not calibration. We fixed risk-group boundaries at the weighted development-set 50th, 80th and 95th percentiles. These four groups are not quartiles.
| Development risk range | Validation participants | Predicted five-year mortality | Observed five-year mortality |
|---|---|---|---|
| Bottom 50% | 2,680 | 4.9% | 3.7% |
| 50th–80th percentile | 1,684 | 16.1% | 13.6% |
| 80th–95th percentile | 769 | 31.4% | 36.9% |
| Top 5% | 320 | 53.9% | 59.3% |
Observed risks come from survey-weighted survival curves; predictions use the development model and its baseline hazard. The validation calibration slope was 1.21 (1.14–1.28), departing from the ideal value of one. Lower risks were overpredicted and higher risks underpredicted. Ranking people reasonably well does not make their absolute probabilities reliable.
What the index measures, and what it does not
This FI summarizes health burden recorded through questionnaires, diagnosis histories and a few examination measurements. It relates to mortality and adds information beyond age, but it does not directly measure aging rate, resilience or lifespan gains after intervention. Its interpretation differs from the Fried frailty phenotype and a simple disease count. Index versus phenotype
Several limits remain. Function and diagnoses are self-reported, while BMI and weight loss include measured values. Missing responses and mortality-linkage eligibility can introduce selection. Half the items are functional, and correlated items and domain weighting affect the score. Age top-coding leaves residual age variation within the 80+ group. Repeated cross-sectional surveys do not show an individual's recovery or deterioration. Temporal validation still uses the same country and survey system. Changes across survey cohorts and relationships between nutrition and deficit accumulation need different analyses; they cannot be inferred directly from our cross-sectional age slope. Cohort comparisons Nutrition and frailty
This page provides neither a personal FI calculator nor a lifespan forecast. Downloads contain corrected coding, statistical scripts, outputs and reproduction instructions; previous versions are retained in internal snapshots. External cohorts, objective physical-performance data or more complete missing-data analyses would justify a further update.
Scope & limitations
- This is an exploratory FI with some items failing ideal age-trend or missingness criteria; it is neither an exact reproduction nor a clinically validated instrument.
- Missingness and linkage eligibility can select the sample; PHQ-9 and weight loss have substantial missingness and were not multiply imputed. Function and diagnoses are self-reported; weight and BMI include measurements.
- Age is harmonized to 80+, leaving within-group age variation unobserved. Cross-sectional age slopes are not individual trajectories.
- Domain and overlapping-band contrasts are conditional associations. The full-range continuous functional-share term has p=0.11; selective significance cannot establish a universal causal claim.
- Deleting items changes the index denominator; HR differences are not fractions of risk explained.
- The temporal split is retrospective and within one survey system. Five-year calibration is imperfect; full survey-resampling uncertainty for C-index was not estimated.
- Selected follow-up times and causes in the public mortality files are perturbed for confidentiality. Observational associations do not identify aging rate or intervention effects.
- The FI association attenuates over time (HR 1.47/1.32 before/after five years); the full-follow-up HR is a model summary, not a constant effect.
Sources
- Searle SD et al. A standard procedure for creating a frailty index. BMC Geriatr 2008;8:24 (PMID 18826625)
paper · Source version: BMC Geriatr 2008;8:24 (abstract level, retrieved 2026-09-19)
Reading scope
Abstract
Abstract level; item-selection criteria and the deficit-sum/denominator scoring rule follow this paper.
- Four item criteria: health-related, increases with age, does not saturate early, low missingness; deficits scored 0-1 or graded; FI = deficit sum / item count
- Blodgett JM et al. A frailty index from common clinical and laboratory tests predicts increased risk of death across the life course. GeroScience 2017 (PMC5636769)
paper · Source version: GeroScience 2017;39:601-613 (PMC5636769 full text archived 2026-09-19)
Reading scope
Relevant sections
REVIEW-001 re-read the abstract, methods and load-bearing results; supplementary materials were not all re-reviewed.
- NHANES 2003-06: 36-item self-report FI mean 0.11, 32-item lab FI 0.15, 68-item combined 0.13; both predict death; log-FI slope 0.034/yr for FI-Self-report
- Quach J et al. Frailty index deficit interchangeability: an empirical test using random survival forests. Age Ageing 2026 (PMC13544438)
paper · Source version: Age Ageing 2026;55(9):afag262 (PMC13544438 full text archived 2026-09-19)
Reading scope
Relevant sections
REVIEW-001 re-read the abstract, methods and load-bearing results; supplementary materials were not all re-reviewed.
- NHANES 1999-2018 CVD sample, 46-item FI: item-level models C 0.71 vs composite FI 0.64-0.67; random-item FIs converge to importance-ranked FI by ~35 items; with enough items, item choice has negligible influence on prediction
- Frailty in NHANES: Comparing the frailty index and phenotype. Arch Gerontol Geriatr 2015 (PMID 25697060)
paper · Source version: Arch Gerontol Geriatr 2015 (abstract level, retrieved 2026-09-19)
Reading scope
Abstract
Abstract level; bounds this article's conclusions to the deficit-accumulation framework.
- FI and Fried phenotype flag overlapping but distinct people in NHANES
- Blodgett JM et al. Changes in the severity and lethality of age-related health deficit accumulation in the USA between 1999 and 2018: a population-based cohort study. Lancet Healthy Longevity 2022
paper · Source version: PMID 36098163; 2022
Reading scope
Abstract
NLM abstract re-read during REVIEW-001; corrected the title/year and the prior claim of changing lethality.
- Abstract: survey cohorts compared; frailty severity increased while the FI–mortality association remained similar (interaction p=0.58). This is not a causal birth-cohort analysis.
- Frailty, nutrition-related parameters, and mortality across the adult age spectrum. BMC Med 2018 (PMID 30360759)
paper · Source version: BMC Med 2018 (abstract level, retrieved 2026-09-19)
Reading scope
Abstract
Abstract level; background literature supporting lifespan-wide FI use.
- Frailty, nutrition parameters and mortality across the adult age spectrum
- NHANES Physical Functioning (PFQ) documentation, cycles D–H
dataset · Source version: PFQ_D-PFQ_H dictionary pages, archived 2026-09-19
Reading scope
Full text
Dictionaries checked page by page: below 60, PFQ061 missingness is a structural skip (screener-negative), coded as no-difficulty in the >=50 sensitivity.
- PFQ061A-T twenty-item battery identical across five cycles; target 20+, under-60 asked on screener positivity
- NHANES MCQ/DIQ/HUQ/DPQ/BPQ/KIQ_U/WHQ/BMX documentation, cycles D–H
dataset · Source version: MCQ/DIQ/HUQ/DPQ/BPQ/KIQ_U/WHQ/BMX dictionary pages per cycle, archived 2026-09-19
Reading scope
Full text
All nine modules x five cycle dictionaries archived under evidence/frailty-deficits-function/sources/; missing codes {7,9}/{77,99}/{777,999} checked per module.
- Disease items MCQ010/160B-M/220, DIQ010, BPQ020, KIQ022, HUQ010/071, DPQ PHQ-9, WHD050/WHQ070, BMXBMI consistent across cycles (MCQ160N/160O/195 dropped as inconsistent)
- NCHS 2019 Public-Use Linked Mortality Files (NHANES 2005–2014)
dataset · Source version: NCHS 2019 public-use linkage (five cycle .dat files, verified 2026-09-19)
Reading scope
Full text
Shares the already-verified download with RESEARCH-011; follow-up runs from the MEC examination (PERMTH_EXM+0.5).
- ELIGSTAT/MORTSTAT/UCOD_LEADING/PERMTH_EXM fixed-width fields; all five cycle files available
- NHANES Analytic Guidelines: weighting and variance estimation
documentation · Source version: NHANES weighting tutorial archived page (reused from study 011)
Reading scope
Full text
Reuses the tutorial archived for RESEARCH-011; MEC weights because exam-collected variables (BMX) are included.
- Pooled-cycle weight = WTMEC2YR/cycles; MEC weight when exam variables included; variance via SDMVPSU/SDMVSTRA
Authorship & review
Author self-review · Codex (AI agent)
2026-09-19 · REVIEW-001 by Codex as the revision coauthor: rebuilt deficits and reran B1–B5; checked SEQN matching, additive contributions, survey covariance, denominators and five-year predictions; re-read relevant NHANES dictionaries, NCHS documentation, Blodgett/Quach methods and results, and the remaining load-bearing abstracts; reconciled both texts, figures and public outputs. This is the revising agent’s self-review, not human, clinical or independent professional review. Original signatures remain historical and were not rebound.
Remaining limitations:
- This is an exploratory FI with some items failing ideal age-trend or missingness criteria; it is neither an exact reproduction nor a clinically validated instrument.
- Missingness and linkage eligibility can select the sample; PHQ-9 and weight loss have substantial missingness and were not multiply imputed. Function and diagnoses are self-reported; weight and BMI include measurements.
- Age is harmonized to 80+, leaving within-group age variation unobserved. Cross-sectional age slopes are not individual trajectories.
- Domain and overlapping-band contrasts are conditional associations. The full-range continuous functional-share term has p=0.11; selective significance cannot establish a universal causal claim.
- Deleting items changes the index denominator; HR differences are not fractions of risk explained.
- The temporal split is retrospective and within one survey system. Five-year calibration is imperfect; full survey-resampling uncertainty for C-index was not estimated.
- Selected follow-up times and causes in the public mortality files are perturbed for confidentiality. Observational associations do not identify aging rate or intervention effects.
- The FI association attenuates over time (HR 1.47/1.32 before/after five years); the full-follow-up HR is a model summary, not a constant effect.
Editorial approval · Codex (AI agent)
2026-09-19 · REVIEW-001 by Codex as the revision coauthor: rebuilt deficits and reran B1–B5; checked SEQN matching, additive contributions, survey covariance, denominators and five-year predictions; re-read relevant NHANES dictionaries, NCHS documentation, Blodgett/Quach methods and results, and the remaining load-bearing abstracts; reconciled both texts, figures and public outputs. This is the revising agent’s self-review, not human, clinical or independent professional review. Original signatures remain historical and were not rebound. Corrected English public expression checked; evidence description only, with no actionable clinical instructions.
Translation check · Codex (AI agent)
· Codex rewrote the corrected English edition and compared its sample sizes, estimands, estimates, intervals, corrections, causal qualifications, figure captions and localized metadata with the revised Chinese and recomputed outputs. This is the revision author’s own language check. Original translation records are retained as superseded history.
Funding & interests
AgingScope has no commercial funding; the analysis uses public data and open-source tools only.
Funding of cited research
None.