Organ proteomic clocks have value for research and risk prediction, while tissue origin, age scales and intervention response require separate validation. We audited public model coefficients and original supplementary tables, then built reference-population, multiple-threshold and protein release–clearance models to examine how these readouts arise and how they can be misinterpreted.
How a number becomes an “organ age”
Oh and colleagues' 2023 study used GTEx tissue RNA data to identify genes expressed at least four times more highly in one organ than in any other. These organ-enriched genes were mapped to plasma protein measurements. Sets assigned to the same organ were then used to train models predicting chronological age. Original study
This introduces biological information, but the training target remains chronological age. The known answer was not a directly measured “true age” of cardiac pumping, renal filtration or brain pathology. The main 2023 models were trained in 1,398 cognitively unimpaired people and tested in other cohorts. The 2025 Olink versions were newly trained in UK Biobank. 2023 original tables 2025 study
In a linear LASSO model, predicted age is an intercept plus a weighted sum of standardized protein measurements; the 2023 versions also include a sex term. The subsequent age gap commonly subtracts the expected prediction for same-aged people and is divided by a relevant standard deviation. A reported age gap therefore is not always predicted age minus chronological age, and one standard deviation does not represent a fixed number of years across models.
| Layer | What is actually tested? | What still needs an answer? |
|---|---|---|
| Chronological-age prediction | Can protein patterns distinguish people of different ages? | Do they reflect organ function or disease processes? |
| Relative age gap | Whose model readout is higher or lower among same-aged peers? | Does it remain comparable with a different reference population? |
| Future disease prediction | Is the readout associated with later outcomes? | Does it improve calibration, decisions and clinical benefit? |
| Intervention response | Does the readout change after treatment? | Does that change reliably represent better health? |
What proteins do the models actually use?
We linked the public 2023 SomaScan and 2025 Olink coefficients to each study's own protein annotations and candidate input panels. Similar organ labels can describe substantially different retained measurements. Coefficient tables Olink coefficients and methods
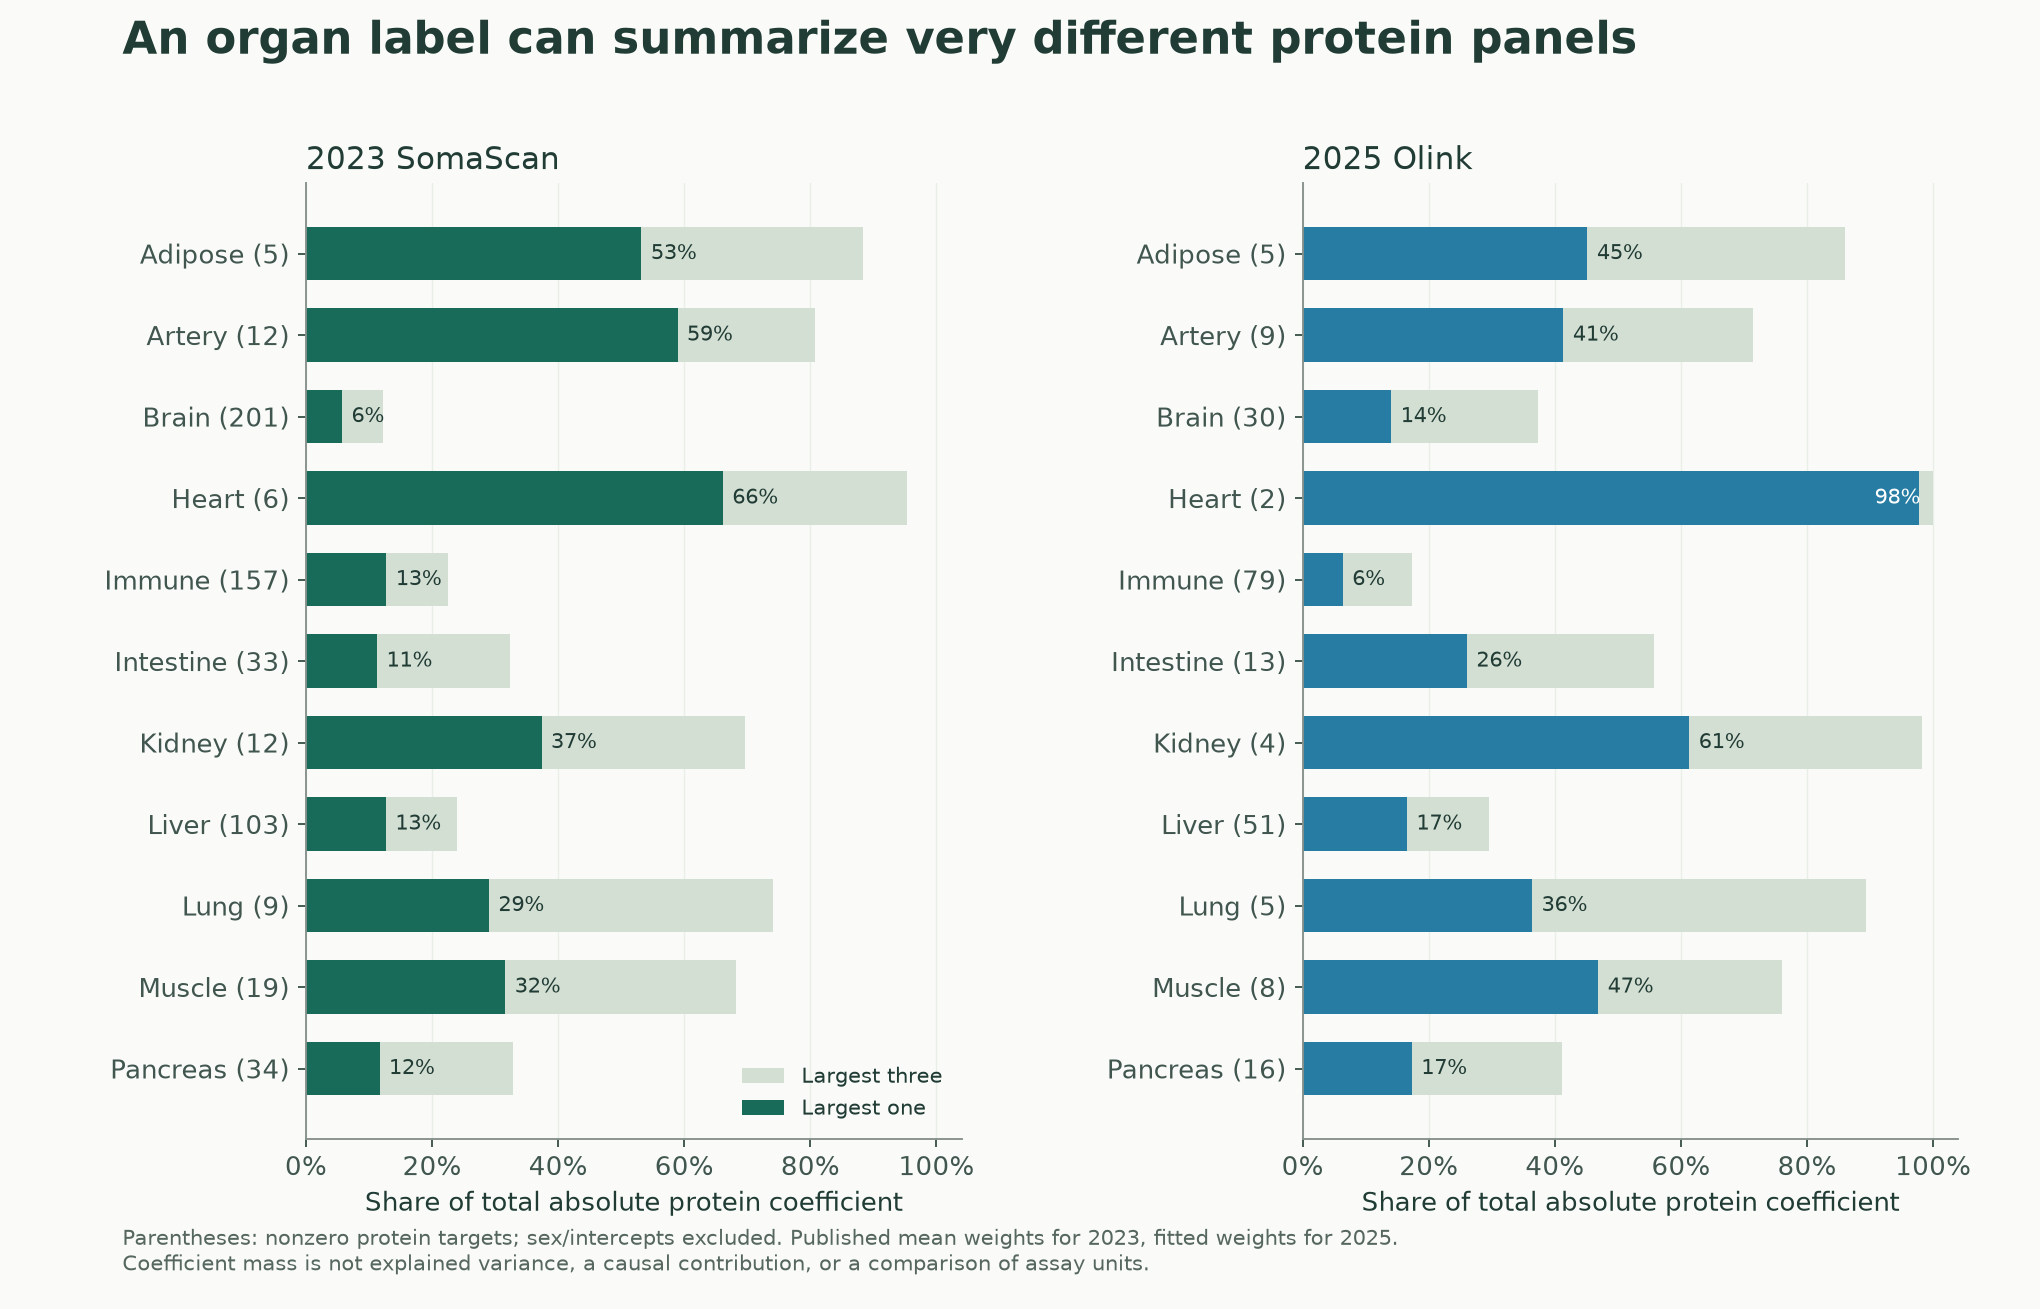
For example, six protein measurements have nonzero mean coefficients in the 2023 heart ensemble. The 2025 version has only two, with the NT-proBNP measurement mapped to NPPB accounting for approximately 97.8% of total absolute protein coefficient mass. Its kidney model has four measurements, with REN accounting for approximately 61.3%. The age-trained brain models have 201 and 30, respectively. The 2023 counts do not mean that every bootstrap submodel uses the same complete set. That paper also contains a cognition-optimized brain model, which is a different clock.
These percentages describe concentration of standardized coefficients, not percentages of organ aging explained or variance explained. Correlated proteins can share information, while measurement noise and platform-specific standardization also affect coefficients.
NT-proBNP is itself associated with cardiac load and clinical cardiac state. A model with a large weight on it may capture useful cardiac risk information. The label “heart age” alone does not establish that the readout measures all aspects of cardiac function.
Annotation adds another detail: some measurements target protein complexes whose components have different enrichment annotations. We checked those component-level matches without treating a complex's organ label as evidence that every component has one exclusive source.
Why can an unchanged sample move with its reference population?
The original 2023 analysis calculated relative gaps within cohorts. The public software defaults to training-cohort standardization and reference curves, with an option to recalibrate within the target cohort. The 2025 application tutorial standardizes target-cohort protein data and fits age references using either a population sample or its controls. SomaScan software Olink application tutorial
A fixed reference supports tracking on one scale but requires handling platform and batch differences. Recalibration in a new cohort can remove technical shifts while also removing real population differences. These are different measurement questions, and the reference rule needs to accompany the result.
Using the actual 2025 heart-model weights, we constructed a hypothetical example. Two groups have the same age distribution, but both protein measurements in the second group are 1.5 baseline standard deviations higher. Age loadings and within-group variability are explicitly assumed. The index sample always retains the same protein measurements; only the proportion of the shifted group in the reference population changes.
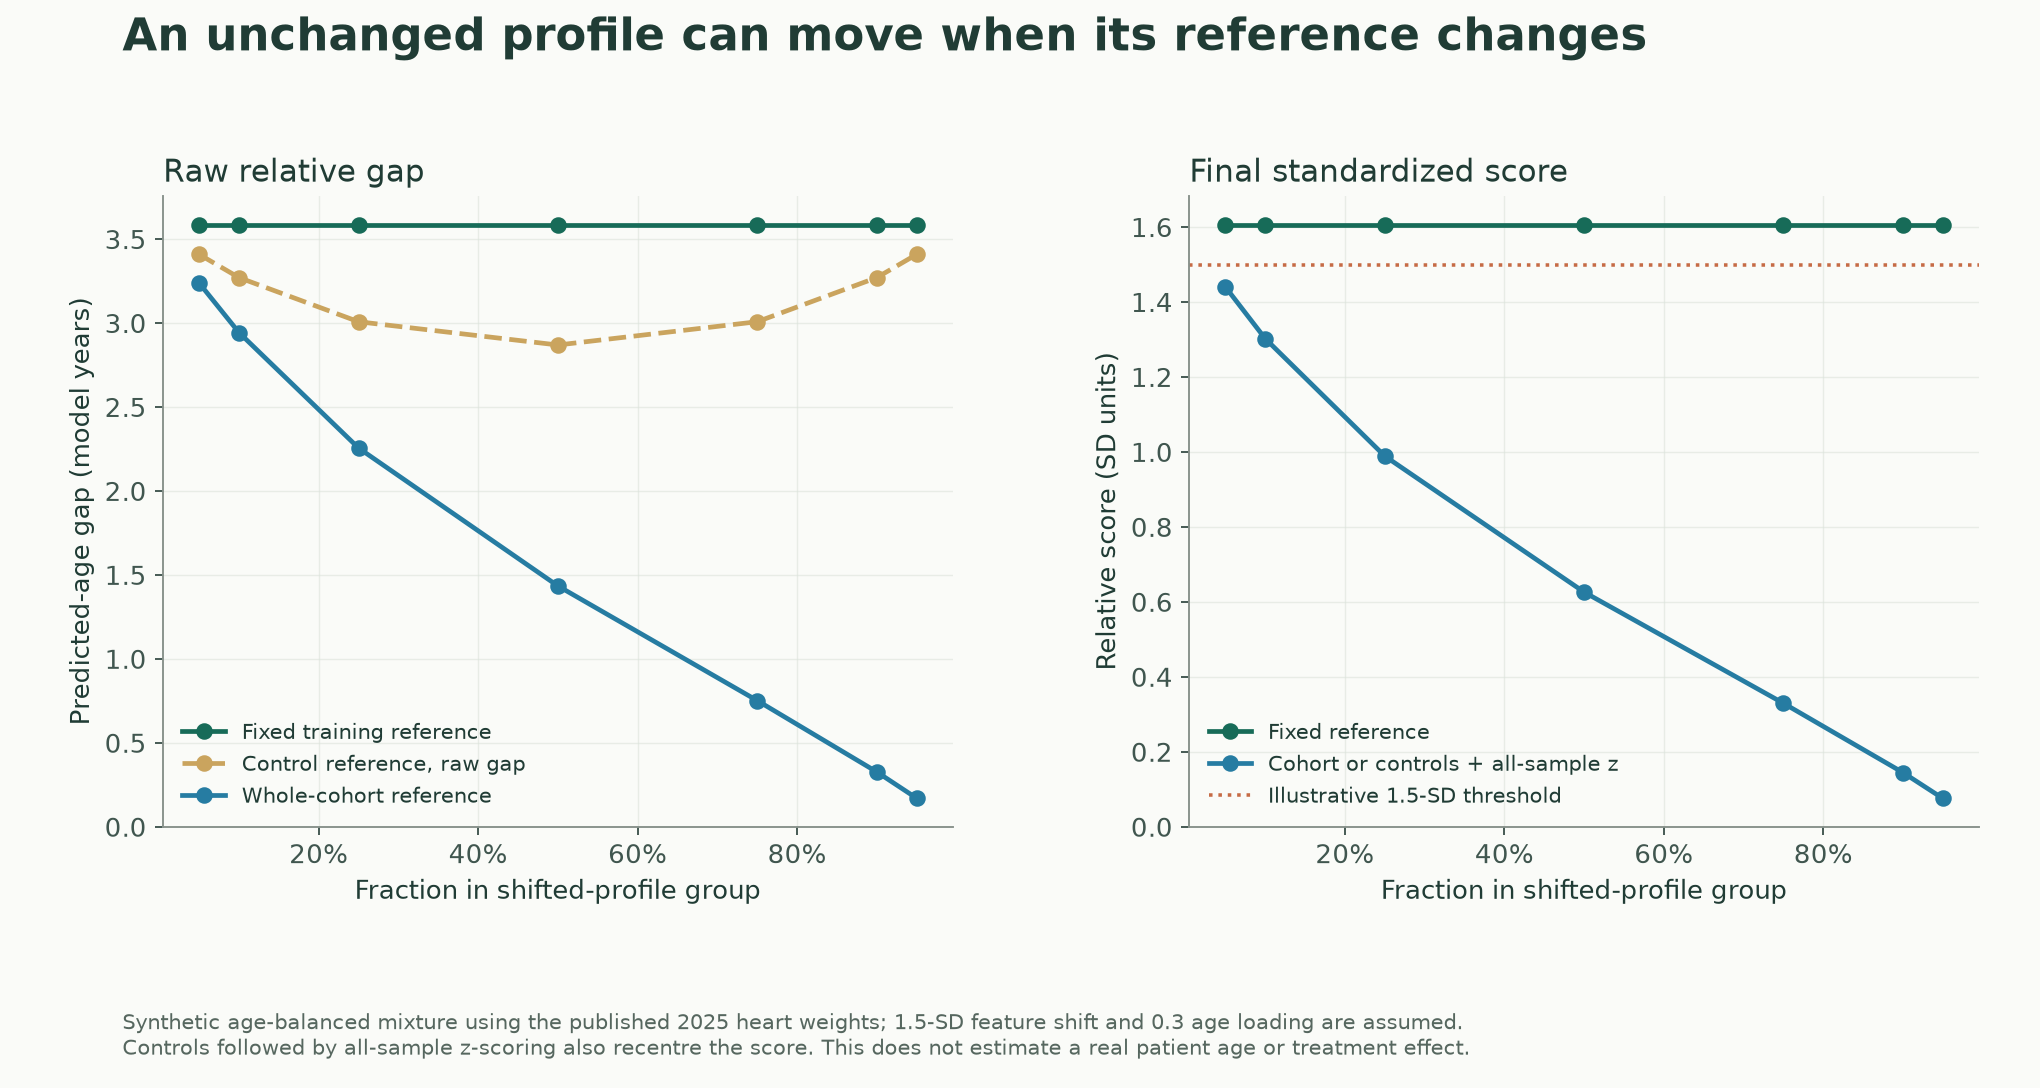
Under a fixed training reference, its standardized score is approximately 1.61. With whole-target-cohort recalibration, it becomes approximately 1.44, 0.63 and 0.14 when the shifted group constitutes 5%, 50% and 90% of the population. Nothing changes in the index sample.
An easily missed step is final standardization. Even if controls define the raw age gap, subsequently z-scoring all participants recentres the score on the entire sample. In our age-balanced example, the two routes give identical final standardized scores.
These are neither patient results nor a fitted disease model. They show why comparison of personal readouts requires consistent model versions, preprocessing and reference rules: a decline in reported years may partly reflect a change in the measuring scale.
Looking at multiple organs creates more tail labels
Calling a score above 1.5 or 2 standard deviations “extreme aging” first defines a location in a distribution. The threshold does not validate a clinical diagnosis by itself.
As a simple reference, if 11 scores are independent standard-normal variables, approximately 22% of individuals have at least one score above positive 2 SD. This calculation does not require adding a distinct subgroup with unusually rapid aging in one organ.
We also used the published 2025 age-gap correlation matrix to construct a reference that preserves its correlations while assuming normal marginal distributions. Following that paper's classification scope, this includes 11 organs plus the Organismal score, for 12 scores in total. Each setting uses 300,000 simulated individuals. Correlation matrix and thresholds
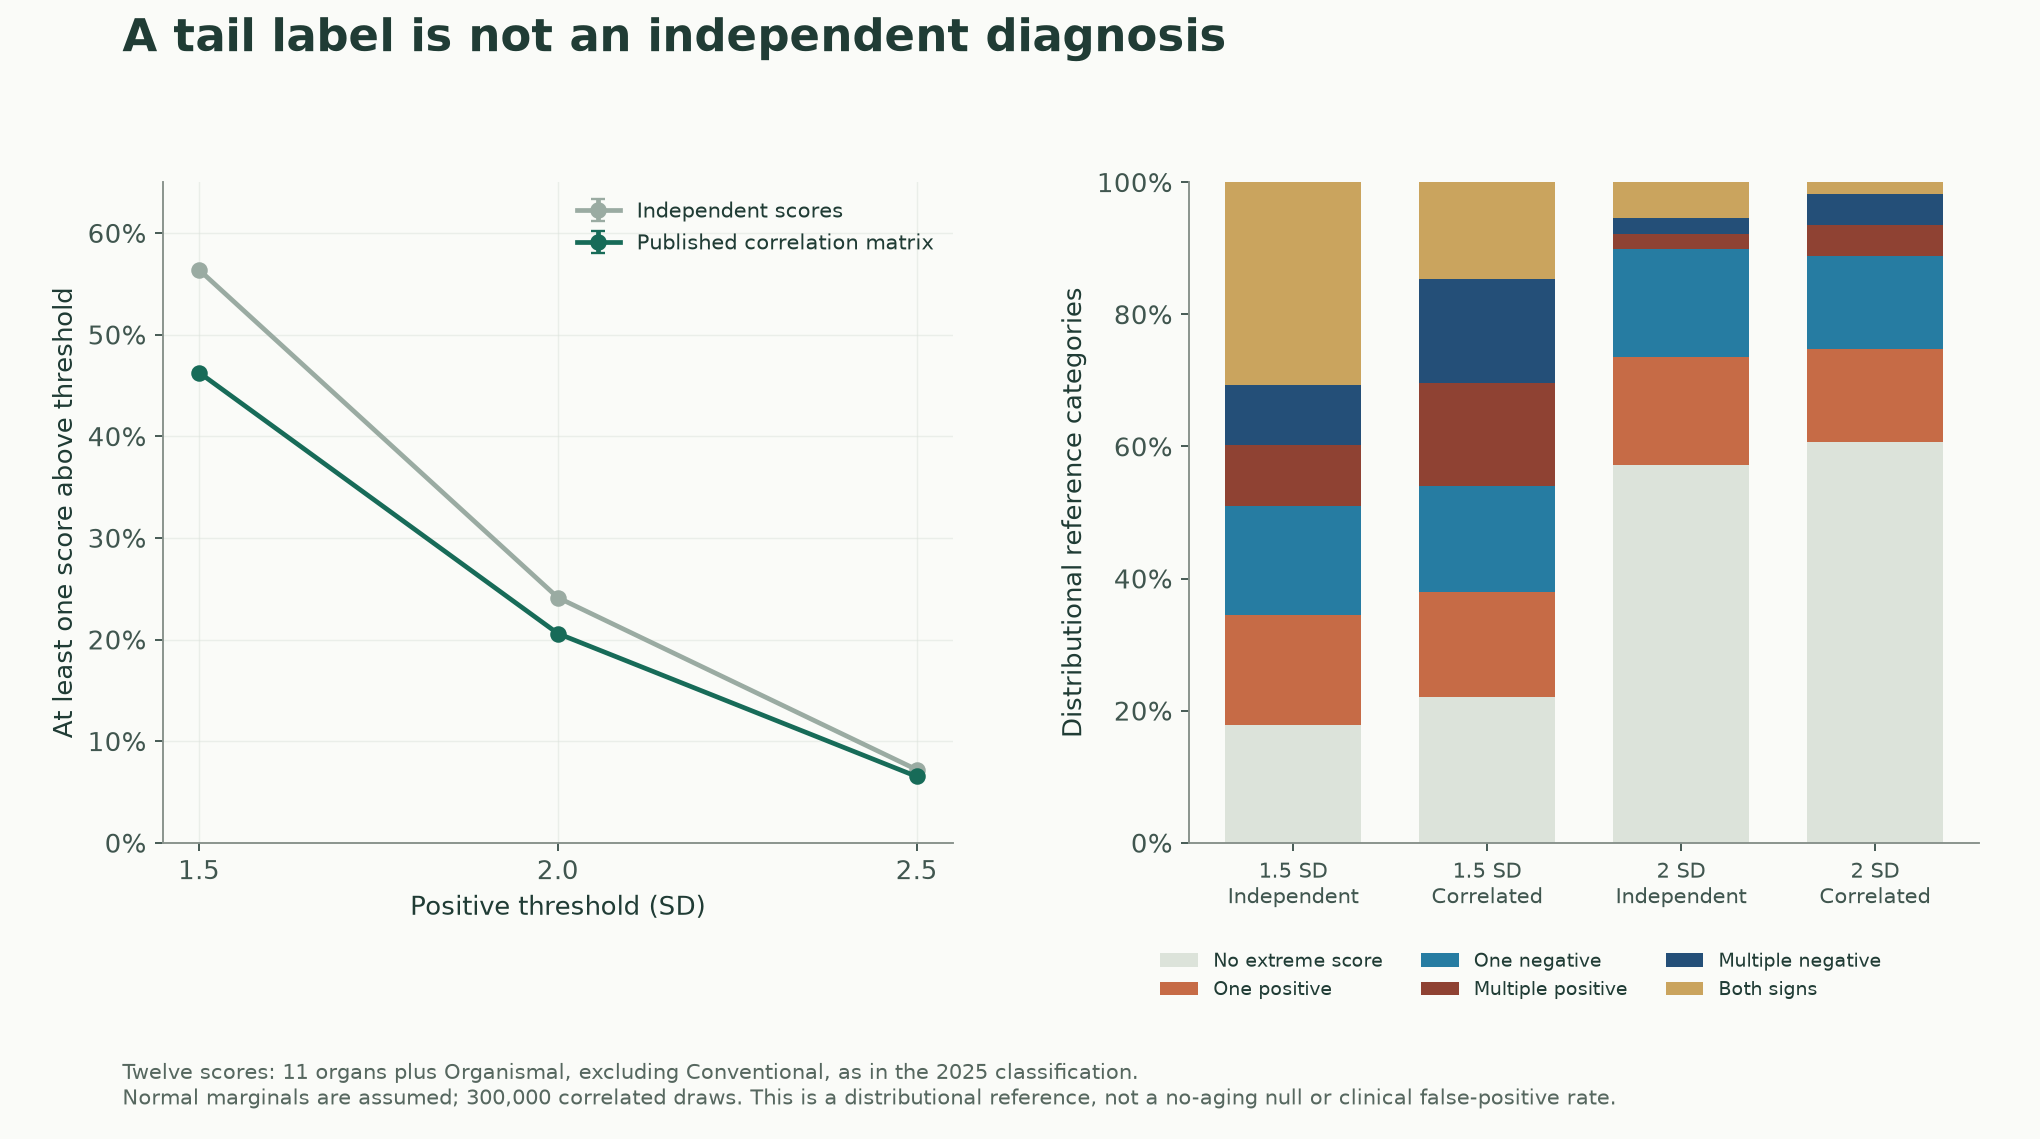
At 1.5 SD, approximately 46% of this reference population has at least one positive extreme score, and approximately 78% has at least one positive or negative extreme score. Increasing the threshold or changing the correlation structure changes those proportions.
This is not an estimate of clinical misdiagnosis or evidence that organ aging does not exist. Normal marginals are an assumption; real distributions may be skewed. We also did not reproduce the 2023 paper's cluster-based ageotypes. The calculation shows that label prevalence needs to be interpreted with the number of scores, thresholds and correlations. Health significance requires separate functional and outcome evidence.
Release and clearance stand between tissue origin and blood concentration
RNA enrichment in an organ is a useful source clue, but it does not trace every circulating molecule to its origin. Proteins can be actively secreted, retained locally, or enter blood through injury, turnover and barrier changes. The human secretome resource itself distinguishes such destinations. Human secretome study
The 2025 study also compared RNA-derived enrichment with tissue proteomics. Approximately 80% of the relevant proteins received concordant classification in the same organ; others were enriched elsewhere or not classified as enriched. Tissue expression, final protein distribution and actual plasma origin are different measurements. Methods and supplementary figures
To illustrate a basic identifiability problem, we used a one-compartment model: concentration changes at the input rate minus the clearance-rate constant times current concentration. With fixed volume and constant parameters, steady concentration equals input rate divided by the clearance-rate constant.
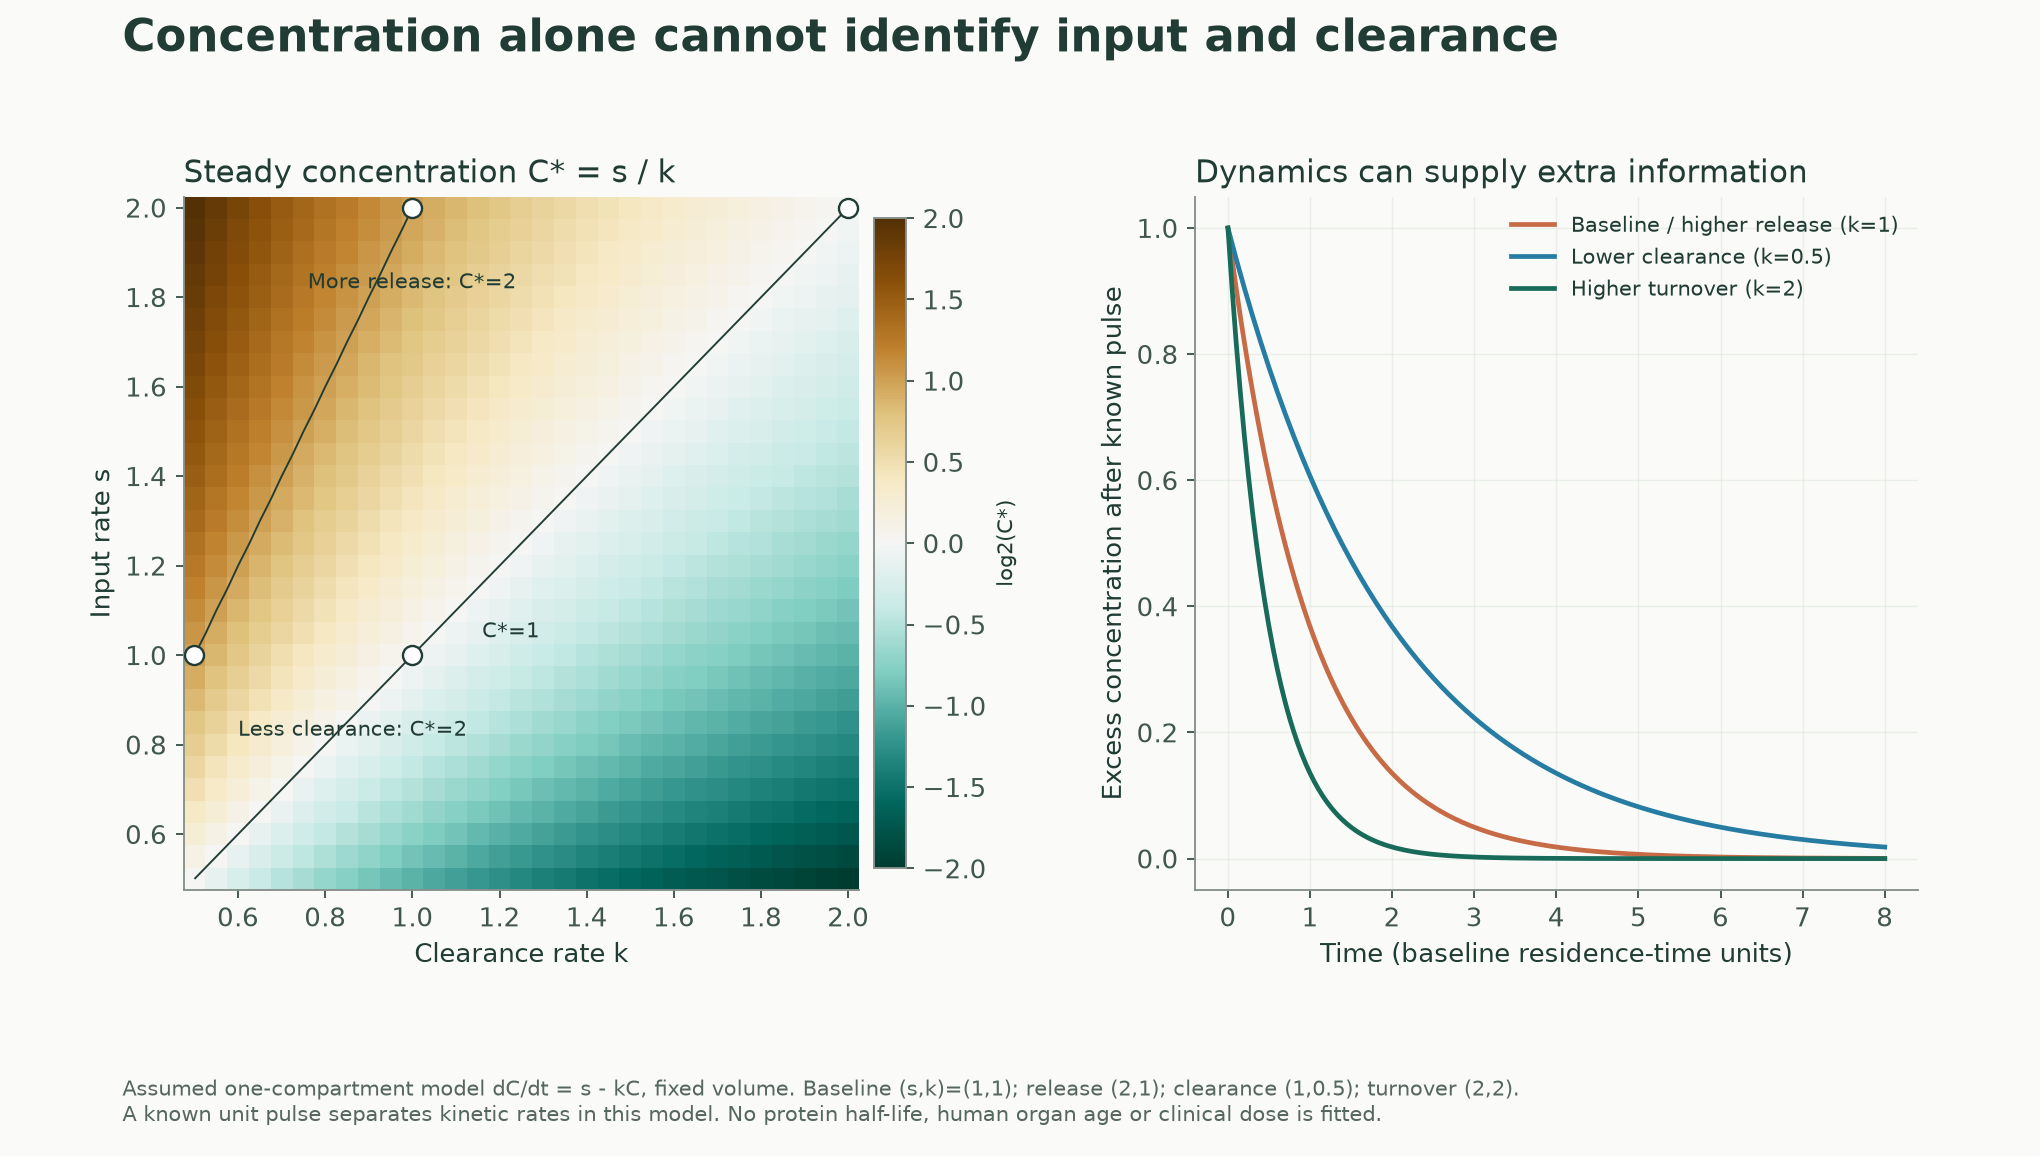
Doubling input and halving the clearance-rate constant both double steady concentration. Doubling both input and clearance can leave concentration unchanged. A single identical concentration cannot distinguish those processes. A known input pulse followed by measurements over time can provide additional kinetic information in this idealized system.
Rates and time units are assumed; no human protein half-life is fitted. This model also does not establish that clearance is the main cause of any real clock's signal.
Empirical evidence likewise requires both sides. Plasma NfL is associated with renal-function measures, but a study examining blood, cerebrospinal fluid or brain imaging found that creatinine adjustment did not materially change NfL's associations with neurodegeneration measures. Clearance is a mechanism to test, not a conclusion established by correlation alone. Kidney function may also relate to actual disease processes. NfL and renal function
What does validation across populations validate?
A separate study by Wang and colleagues trained LightGBM models in UK Biobank and evaluated them in China's CKB and the US Nurses' Health Study. It provides valuable evidence across populations, using different protein selection, algorithms and calibration from the LASSO clocks above. Cross-population study and original tables
We recalculated the correlation between the published model-performance profiles: approximately 0.975 for UKB versus CKB, 0.959 for UKB versus NHS, and 0.928 for CKB versus NHS. These correlations compare the performances of 11 models. They do not mean that every organ's age prediction has almost 98% individual accuracy.
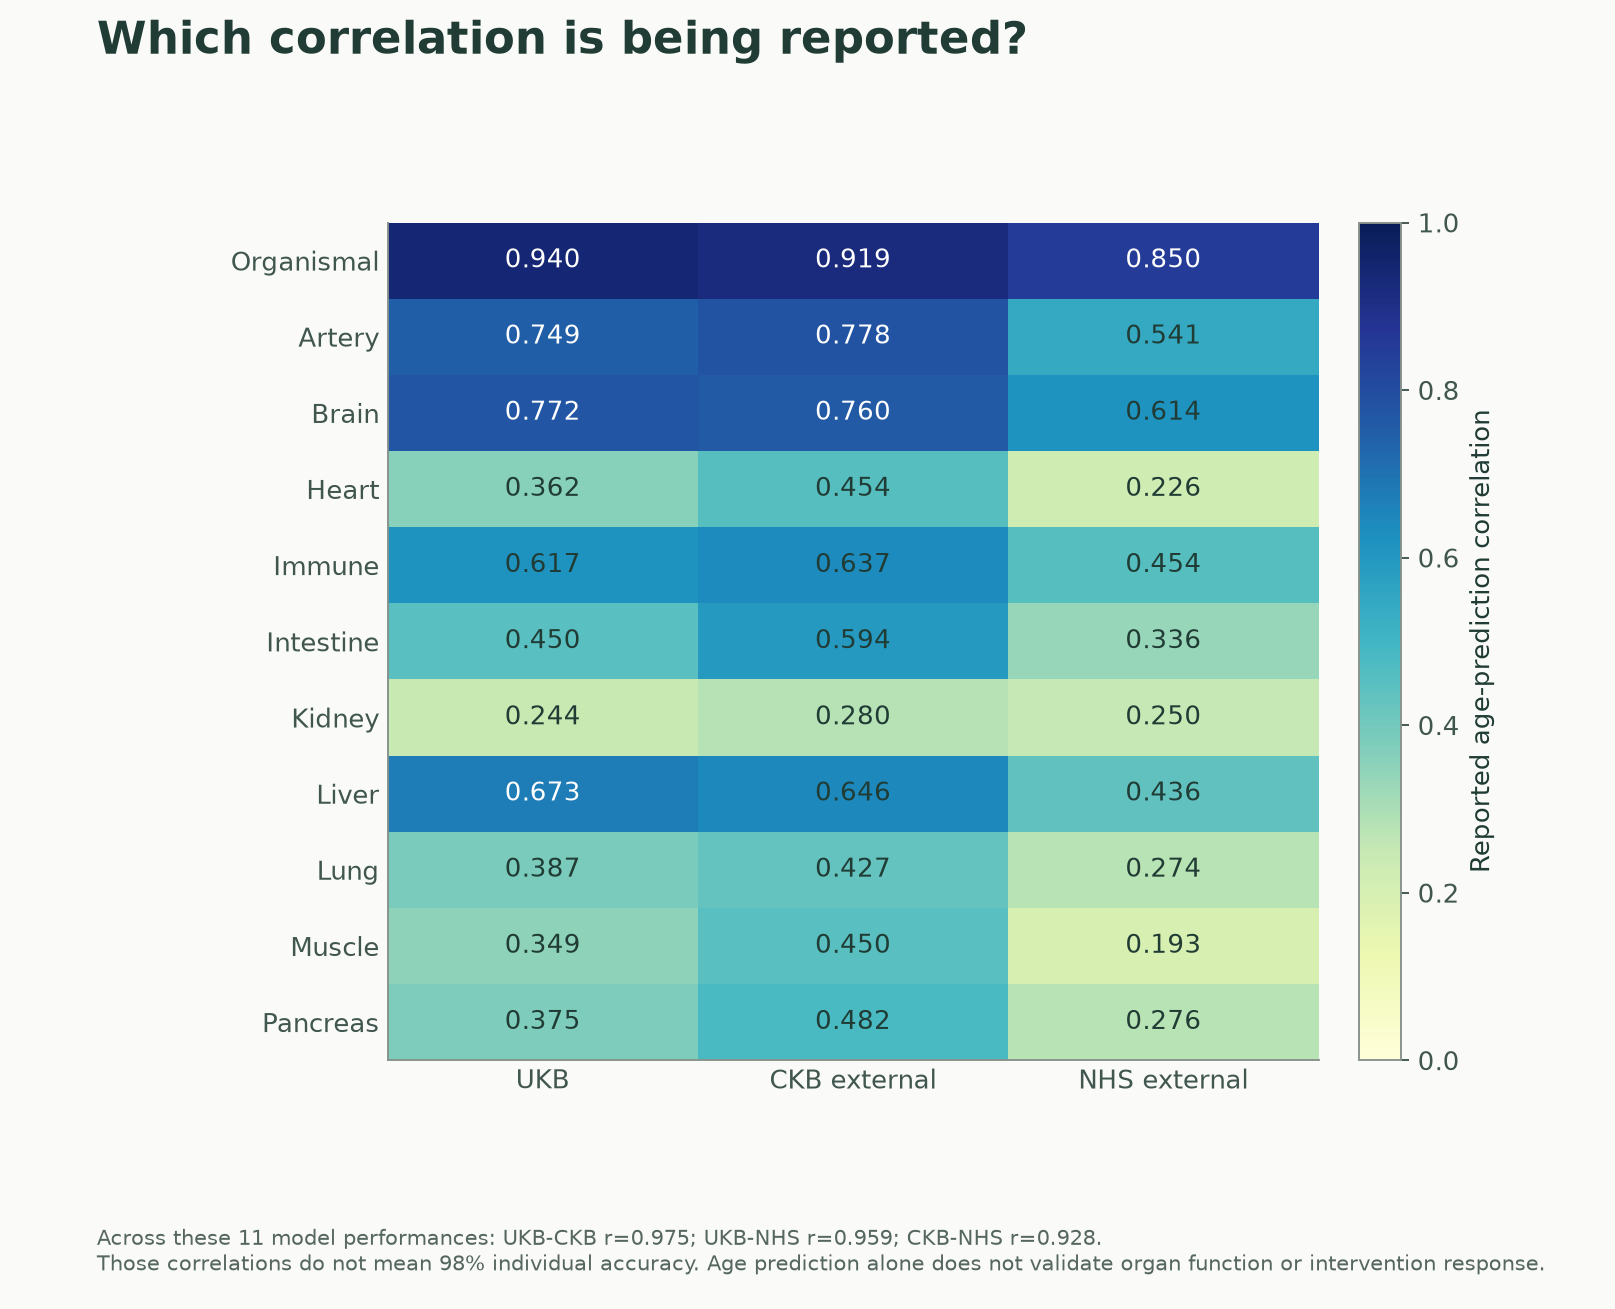
For individual models, brain-age correlations with chronological age are approximately 0.772, 0.760 and 0.614 in the three populations. Heart-model correlations are approximately 0.362, 0.454 and 0.226. Correlation also depends on age range: identical prediction noise can produce higher correlations in a population with a wider age span.
These external samples are not three equivalent general-population surveys. The CKB sample comes from an ischemic-heart-disease case–cohort design, while the NHS sample comes from nested sampling for a colon-cancer study and includes only women. Cross-population results remain valuable, while age prediction, absolute calibration and transport of clinical risk require separate assessment.
Disease prediction has support and failures to replicate
Similar names do not make findings completely independent or interchangeable replications.
| Study | Main information supplied | Key interpretive difference |
|---|---|---|
| 2023 SomaScan study | Associations with diseases, function and subsequent outcomes | Age-trained and cognition-optimized models differ |
| 2025 Olink study | Disease and mortality associations in approximately 44,500 people, with cross-platform and longitudinal analyses | Proteins and training differ from the 2023 models |
| Wang cross-population study | Age prediction and outcome associations in UKB, CKB and NHS | Different algorithm; some populations are shared with other papers |
| 2026 EPIC study | Long-term outcomes evaluated with existing SomaScan models | A midlife case–cohort design; not a rerun of the 2025 Olink models |
The 2025 Olink study found strong prognostic associations for brain and immune scores for some outcomes, alongside only moderate-to-strong agreement between platforms. Longitudinal analyses required separately trained models covering fewer proteins. Approximately 68% of those initially labelled extreme no longer met the same extreme threshold at a later measurement. Technical change, genuine biological change and regression to the mean can all contribute; leaving an extreme category is not direct evidence of organ rejuvenation. Olink study
The 2026 EPIC study analysed 17,473 participants using a case–cohort design with design-appropriate weighting. It supported associations of organ scores with certain corresponding diseases and mortality, but did not replicate clear neurodegenerative-outcome prediction with the 2023 SomaScan brain model it evaluated. Platform, model version, entry age, outcomes and follow-up duration may contribute to the difference. These data cannot isolate one explanation. EPIC final publication
Consequently, the brain clock cannot be described as the strongest predictor in every independent study.
Predictive improvement and clinical benefit remain separate questions
EPIC compared discrimination of mortality models. Recalculation from its actual source table shows that adding the Global proteomic age gap to a model with age, sex, center and lifestyle risk factors raises concordance from approximately 0.730 to 0.739. Adding all organ and Organismal scores yields approximately 0.743. Original figure values and methods
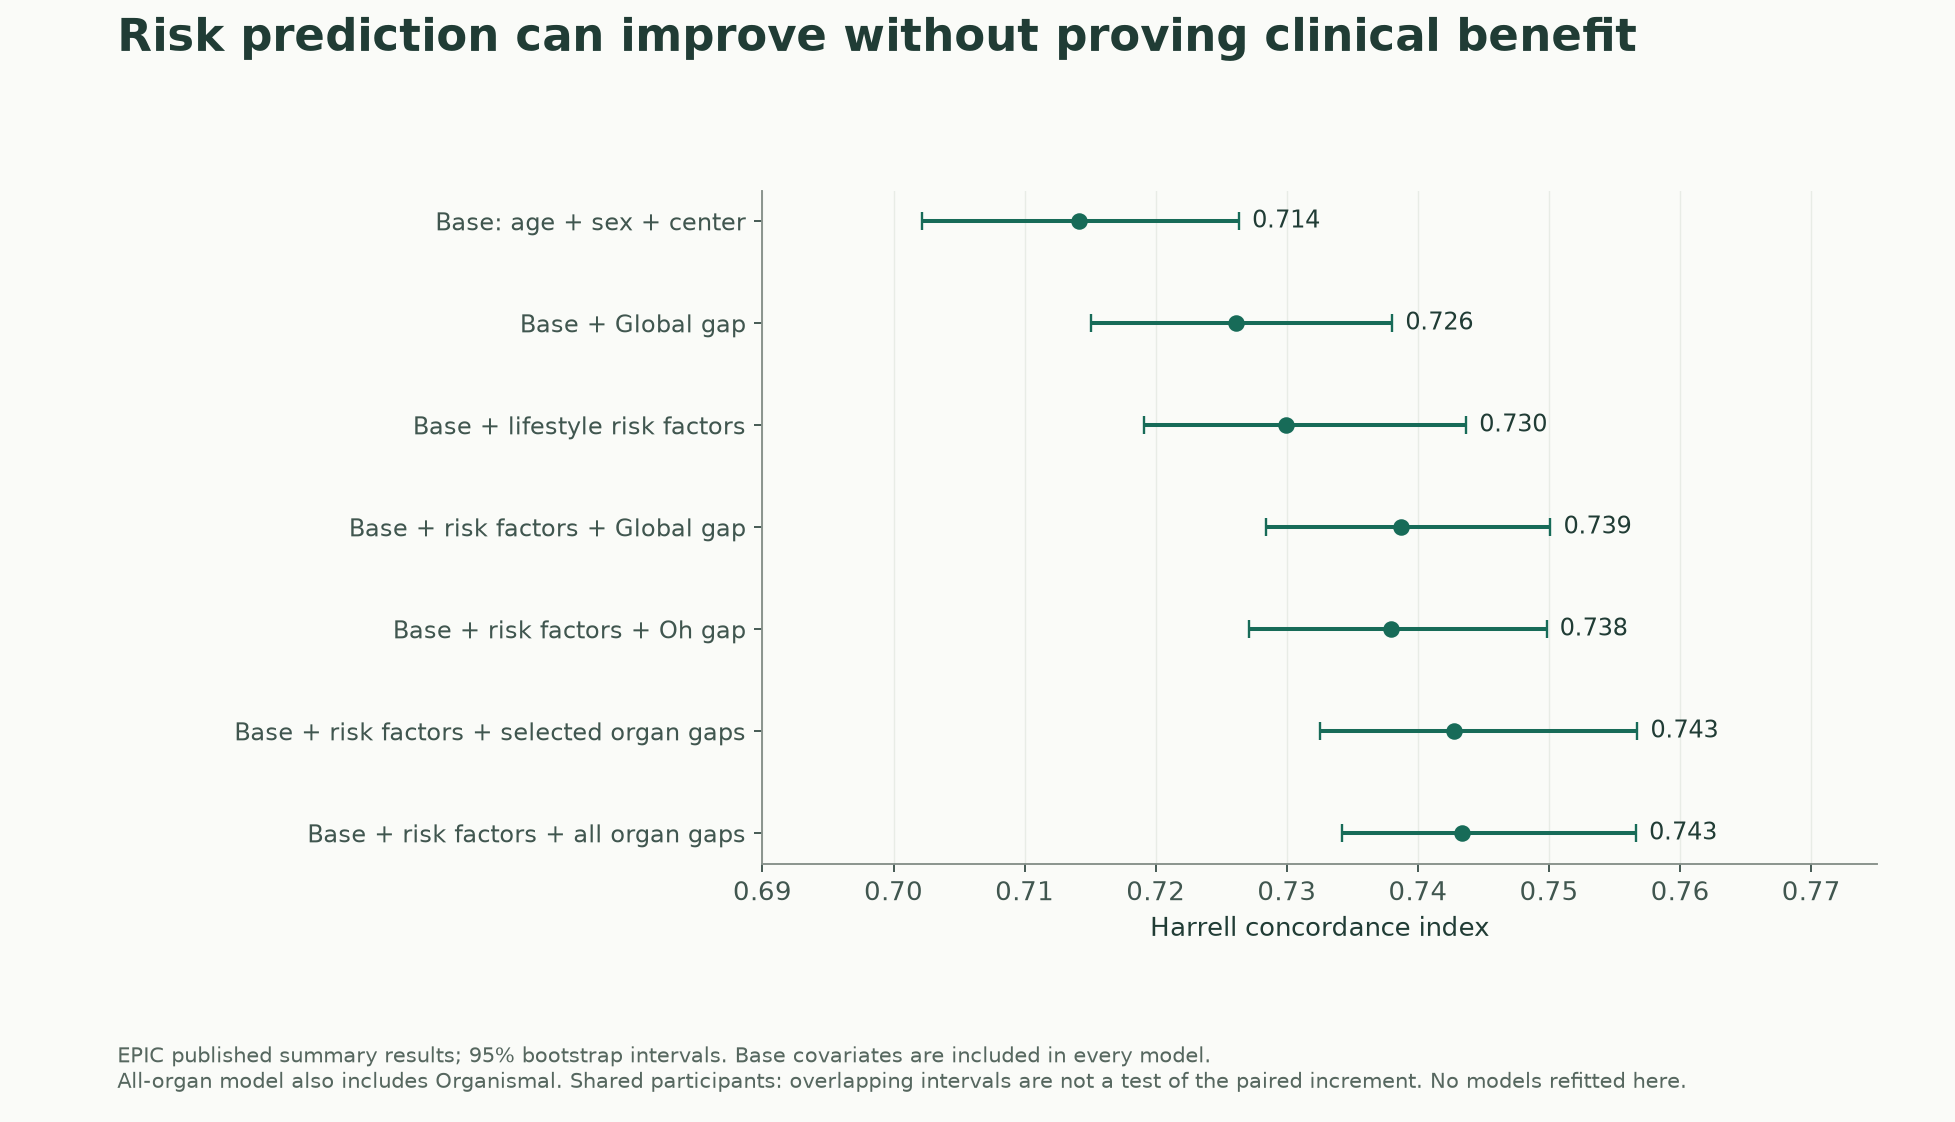
The latter increment is approximately 0.0135. It describes discrimination of outcome ordering, not 1.35% fewer deaths. The figure retains the authors' bootstrap intervals. Since models share participants, overlap of two intervals does not replace a paired test of their difference.
We did not obtain a participant matrix that permits these analyses to be rerun, and did not repeat case–cohort weighting, model fitting or the authors' bootstrap. Public summary tables support arithmetic checks but cannot independently establish calibration, clinical thresholds or decision net benefit. Even statistical improvement leaves the question of whether the model changes appropriate clinical decisions and ultimately improves outcomes.
Finer cell labels do not automatically resolve these limits
Ding and colleagues' 2026 study extended protein clocks to cell-type-enriched panels, examining disease and mortality across SomaScan, Olink and multiple cohorts. It moves to a finer cellular level while still relying primarily on RNA enrichment to label models. Cell-type study
The authors explicitly acknowledge that some proteins assigned to particular cells may be produced or released more broadly under other conditions. Some outcome associations persist after renal adjustment, so all signals cannot simply be attributed to clearance. At the same time, analyses using existing Knight-ADRC and UKB populations cannot count as wholly new independent population replications.
Just as sequence counts and function require an additional evidential connection in our immune-diversity study, finer protein labels need testable links to actual sources, tissue function and clinical outcomes.
What can these readouts best answer now?
Organ proteomic clocks can investigate population heterogeneity, generate mechanistic hypotheses and test whether they supplement existing risk models. They have outcome evidence beyond age fitting, while remaining short of a common physiological-age ruler for all organs.
The most informative next studies would combine fixed model versions and reference rules with repeated sampling and organ-function or tissue measurements, and evaluate clinical prediction in independent populations. Intervention research must additionally test whether treatment-induced score changes reliably predict clinical outcomes, including whether a score can change through pathways that do not improve health.
Our original-table audit and conditional models explain how readouts arise and which processes a single blood draw may not separate. They do not recover anyone's true organ age or estimate life extension.
Download code, public numerical inputs, original figures and verification results
Scope & limitations
- Recalculates public coefficients, annotations and figure summaries without participant matrices; no external patient reanalysis, model retraining or clinical calibration.
- RNA enrichment and component matching check annotation consistency, without direct tracing of circulating molecules or measurement of organ function.
- Studies differ in platform/cohort reuse, selection and endpoints. Absent SomaScan brain prediction does not directly refute a different Olink model.
- Reference mixtures, normal tails and kinetic parameters are assumptions, not clinical misdiagnosis rates, real patient ages or human protein half-lives.
- The 2023 coefficients are ensemble means and the 2025 coefficients a fitted model; mass shares are not explained variance. Training-example r labels, source-table discrepancies and EPIC SE/CI differences are retained without guessed correction.
- Author estimates and intervals are not rerun from individuals; no paired-increment interval, absolute risk, decision net benefit or treatment surrogacy established.
- Legacy imaging/metabolomic/GWAS/LLM/HIV/animal branches were not comprehensively reassessed. Full Whitehall/Wen main texts unavailable; some recent adjacent studies only abstract-screened.
- One Codex agent performed authorship, computation, self-review, translation and editing; not independent human professional review.
Sources
- Oh et al. Organ aging signatures in the plasma proteome track health and disease. Nature (2023)
paper · Source version: 2023
Reading scope
Relevant sections
Read enrichment, age-trained versus cognition-optimized models, clinical associations, discussion, training/LOWESS methods and disclosures. Chronological-age training is not direct function measurement. Some cohort counts differ across text/tables; no combined participant total reconstructed.
- Organ-enrichment Results; organ disease Results; Discussion
- Methods: identification, bagged LASSO and age-gap calculation
- Oh et al. Original supplementary tables: annotations, model coefficients and performance (2023)
supplement · Source version: 2023 supplementary XLSX
Reading scope
Relevant sections
Checked actual ST3/5/7/8 annotations, candidate panels, mean coefficients and performance; retained relevant ST11/12 summaries. Did not refit each of the 500 models in ST6. Sex is separate from proteins; complexes are checked by component.
- ST3, ST5, ST7, ST8; selected ST11–12 cells
- Oh: organage software, fixed training references and optional cohort recalibration
software · Source version: commit 59303fd / read 2026-09-20
Reading scope
Relevant sections
Pinned commit 59303fd0dccc191be1ff34bf0bbf5efd8b90387a. Read OrganAge.py and the prediction example, including normalization, fixed LOWESS/scalers and optional cohort recalibration. Only relevant training-notebook paths inspected. No model pickle executed and no patient predictions made.
- OrganAge.py: normalize, setup_input_dataframe, calculate_lowess_yhat_and_agegap, zscore_agegaps
- Predict organage example: cohort recalibration
- Oh et al. Plasma proteomics links brain and immune system aging with healthspan and longevity. Nature Medicine (2025)
paper and supplement · Source version: 2025
Reading scope
Relevant sections
Read main relevant Results/Methods/Discussion, actual supplementary figure 1–4 captions, ST2–5 and relevant outcome tables. Checked center split, normalization/imputation, cross-platform differences, 1.5k longitudinal surrogates and loss of extreme status. Coefficient concentration is not explained variance; 80% RNA/tissue-protein concordance is not direct plasma source tracing.
- Results: model derivation, cross-platform/longitudinal checks
- Methods: QC, enrichment, age estimation; Supplementary ST2–5, ST6/11–12
- Oh: organageUKB training and application tutorials
software · Source version: commit b49aa38 / read 2026-09-20
Reading scope
Relevant sections
Pinned commit b49aa385835f19d374d94a37410da1550d655905. Read both notebook source texts. Checked target-cohort protein z-scoring, control/population age references and final all-sample agegap z-scoring. The training example obtains r from sqrt(R-squared); preserved table labels without claiming an independently calculated Pearson r. Original cohort matrices unavailable; author training not rerun.
- Github_tutorial.ipynb: prediction and agegapz
- UKB_Olink_3k_aging_model_github.ipynb: training and resstat
- Wang et al. Organ-specific proteomic aging clocks predict disease and longevity across diverse populations. Nature Aging (online 2025; issue 2026)
paper and supplement · Source version: 2025 online / 2026 issue
Reading scope
Relevant sections
Read model/cross-population results, prediction section, discussion and methods; actual ST3–5, selected ST7/8/11 and supplement Notes5–7. CKB is IHD case-cohort sampling; NHS is colon-cancer sampling in women. Across-model performance correlation is not 98% individual accuracy. Inspected relevant ROC glm/predict code; no complete clinical/GWAS/LightGBM reanalysis. Figure5 retains the ST5 UKB label without additionally assuming that column represents only a holdout subset.
- Results: model performance and prediction comparison
- Methods; supplementary Notes5–7; ST3–5
- Organ-PAC Fig6.R, relevant fit/predict function
- Robinson et al. Associations of proteomic age clocks with lifestyle risk factors, incident chronic diseases and mortality in two European cohorts. Nature Aging (2026)
paper and supplement · Source version: 2026 final publication
Reading scope
Relevant sections
Read final-paper design, relevant outcomes/discussion, weighted-Cox and concordance methods; supplement S1/S4 and actual Figure6 XLSX. Checked model version, absent clear brain prediction and case-cohort limits. Recalculated differences/exponentiation only and retained reported CIs. Figure6I SE entries do not directly reproduce supplied CIs; no guessed replacement, weighted refit or paired bootstrap.
- Results: organ models and mortality discrimination
- Methods: statistics and reproducibility
- Supplement TableS1/FigS4; Figure6 source values
- Ding et al. Plasma proteomic signatures of cellular aging predict human disease. Nature Medicine (2026)
paper · Source version: 2026
Reading scope
Relevant sections
Read relevant Results, source limitations, enrichment/training/cohort/PARS/stability methods, renal-sensitivity captions and disclosures. Recognized reuse of Knight-ADRC/UKB and nonexclusive protein sources. Supplement-table structure only screened; no cellular/risk-model or full supplementary-result reanalysis.
- Relevant Results and Discussion
- Methods: cell enrichment, age estimation, cohorts, stability and PARS
- Renal-sensitivity captions; competing interests
- Tang et al. Association of neurofilament light chain with renal function: mechanisms and clinical implications. Alzheimer’s Research & Therapy (2022)
paper · Source version: 2022
Reading scope
Relevant sections
Read ADNI/VETSA populations, relevant result interpretation and discussion. CSF/MRI associations persist after creatinine adjustment; clearance and shared biology are different explanations. Clearance is not an identified molecular mechanism here. No twin-model rerun or personal adjustment recommendation.
- Methods: Study1/Study2
- Discussion: creatinine, CSF/MRI and clearance hypothesis
- Uhlén et al. The human secretome. Science Signaling (2019)
paper · Source version: 2019
Reading scope
Relevant sections
Read the archived paper abstract, introduction and localization framework (main-text pages1–2), distinguishing blood secretion, local retention and leakage. Detectable plasma proteins are not all actively secreted. Full HPA database analysis not rerun.
- Main-text pages1–2: abstract, introduction and secretome localization
Authorship & review
Author self-review · Codex (AI agent)
2026-09-20 · Same-author Codex self-review of actual primary sections, supplements and public code: source labels, training targets, mean versus single-model coefficients, references/standardization, platform/cohort reuse, tail definitions, EPIC weighting/discrimination, release-clearance and renal counterevidence. Compared both languages and six figures. Corrected our empty-string counting and complex parsing; clarified nonzero mean-weight counts. Retained source SE/CI discrepancies and reading limits without guessed correction. Independently XML-checked 4,196 source cells; 386 R/Python comparisons passed and 26 fresh-output files were identical. No participant matrices, clinical refitting/calibration or independent human review. Website checks recorded separately.
Remaining limitations:
- Recalculates public coefficients, annotations and figure summaries without participant matrices; no external patient reanalysis, model retraining or clinical calibration.
- RNA enrichment and component matching check annotation consistency, without direct tracing of circulating molecules or measurement of organ function.
- Studies differ in platform/cohort reuse, selection and endpoints. Absent SomaScan brain prediction does not directly refute a different Olink model.
- Reference mixtures, normal tails and kinetic parameters are assumptions, not clinical misdiagnosis rates, real patient ages or human protein half-lives.
- The 2023 coefficients are ensemble means and the 2025 coefficients a fitted model; mass shares are not explained variance. Training-example r labels, source-table discrepancies and EPIC SE/CI differences are retained without guessed correction.
- Author estimates and intervals are not rerun from individuals; no paired-increment interval, absolute risk, decision net benefit or treatment surrogacy established.
- Legacy imaging/metabolomic/GWAS/LLM/HIV/animal branches were not comprehensively reassessed. Full Whitehall/Wen main texts unavailable; some recent adjacent studies only abstract-screened.
- One Codex agent performed authorship, computation, self-review, translation and editing; not independent human professional review.
Editorial approval · Codex (AI agent)
2026-09-20 · Same-author Codex self-review of actual primary sections, supplements and public code: source labels, training targets, mean versus single-model coefficients, references/standardization, platform/cohort reuse, tail definitions, EPIC weighting/discrimination, release-clearance and renal counterevidence. Compared both languages and six figures. Corrected our empty-string counting and complex parsing; clarified nonzero mean-weight counts. Retained source SE/CI discrepancies and reading limits without guessed correction. Independently XML-checked 4,196 source cells; 386 R/Python comparisons passed and 26 fresh-output files were identical. No participant matrices, clinical refitting/calibration or independent human review. Website checks recorded separately.
Translation check · Codex (AI agent)
· The same author compared both languages paragraph by paragraph: targets, model versions, coefficient units, reference rules, hypothetical parameters, probabilities, clinical discrimination, cohort reuse, six figures and limitations. English source/funding/review metadata included. Not independent human language review.
Funding & interests
One Codex agent performed research, computation, self-review, translation and editing. No external commercial funding for this task or independent human clinical professional review.
Funding of cited research
Reviewed papers include public/foundation support. Oh2023 discloses related patents and Teal Omics/other company equity or advisory relationships. Oh2025 and Ding2026 also disclose Teal and other commercial interests, with Ding listing additional industry funding/consulting. Wang, Robinson EPIC and the cited NfL study declare no relevant competing interests. Funding identity does not replace methodological evaluation.