What our investigation found
The most defensible conclusion is that some interventions can change some aging-related methylation measures. A lower reading alone does not establish which biological process changed, or how many additional years someone will live. This does not make clocks meaningless, and it does not make every decrease a measurement artifact.
| Our analysis | What it shows | What it does not establish |
|---|---|---|
| Reanalysis of published CALERIE measurements | DunedinPACE contrasts point in a similar direction to the paper; our simpler analysis has wider intervals | Without participant identifiers and covariates, we cannot reproduce the longitudinal adjusted model |
| Changing mixtures of fixed, measured cell profiles | An illustrative 10 percentage-point transfer changes Hannum readings by −0.72 to −3.47 years | These are not intervention effects or an explanation of CALERIE's results |
| Noise and multiple-testing simulations | Selecting high baseline readings or favorable clocks can generate apparently positive findings | The parameters do not describe any particular commercial test |
Our scope is human blood DNA methylation. We do not rank commercial tests or all longevity interventions, or interpret blood readings as the age of every organ.
The “age” in a blood sample is a model output
DNA methylation is a chemical modification of DNA. An assay estimates methylation proportions at individual sites, and an algorithm compresses many measurements into a score. Its meaning depends on the target used to train it.
| Examples | Main training target | A boundary to keep |
|---|---|---|
| Hannum and Horvath | Chronological age | Accurate age prediction does not identify all forms of aging damage |
| PhenoAge and GrimAge | Mortality-related clinical phenotypes, protein proxies and other features | An association with risk does not prove that lowering the score improves health |
| DunedinPACE | Longitudinal, multisystem physiological change within a birth cohort | A single sample estimates a learned proxy for pace; it does not directly observe the next year |
DunedinPACE was developed using four assessments of 19 physiological indicators between ages 26 and 45 in the same cohort. Its scale refers to the pace of aging in a reference population. It is not an age clock measured in years: a decrease of 0.02 cannot be translated into “0.02 years younger.” PC PhenoAge and PC GrimAge use principal components to improve technical reliability and should be distinguished from the original clocks. DunedinPACE development CALERIE methods and Supplementary Table S2
Four evidential questions must be kept separate: Is the measure repeatable? Does it predict health outcomes? Can an intervention change it? Does the intervention-induced change reliably predict clinical benefit? Answering the first three does not automatically answer the fourth. Surrogate endpoint validation
A mechanism model: can the clock move while cell profiles stay fixed?
Blood contains mixtures of neutrophils, T cells, B cells and other populations. Sorted-cell experiments show that cells from the same donor can have markedly different methylation profiles. Reinius and colleagues
Let pₖ be the fraction of DNA contributed by cell type k, and mⱼₖ its methylation proportion at site j. Approximate the mixed measurement as βⱼ = Σₖ pₖmⱼₖ. For a linear clock with fixed weights, C = b + Σⱼ wⱼβⱼ. Its finite change separates into:
ΔC = Σⱼₖ wⱼ mⱼₖ Δpₖ        composition change
   + Σⱼₖ wⱼ pₖ Δmⱼₖ        within-cell methylation change
   + Σⱼₖ wⱼ Δpₖ Δmⱼₖ       interaction of both changes
This is an algebraic identity under stated assumptions, not a complete theory of aging. It generates a testable prediction: if composition can change a reading, varying proportions while holding cell profiles fixed should move the clock in computational mixtures.
We used neutrophil and CD8 T-cell profiles from six adult male donors in GSE35069, with all 71 Hannum markers and weights distributed by methylCIPHER. All required values were present in these 12 samples; no imputation was needed for the main scenario. We changed the DNA mixture from 80:20 to 70:30 while holding both profiles fixed. Dataset Algorithm and license
| Donor | Hannum change caused by the specified mixture alone |
|---|---|
| 1 | −0.72 years |
| 2 | −2.62 years |
| 3 | −2.81 years |
| 4 | −3.47 years |
| 5 | −2.96 years |
| 6 | −1.34 years |
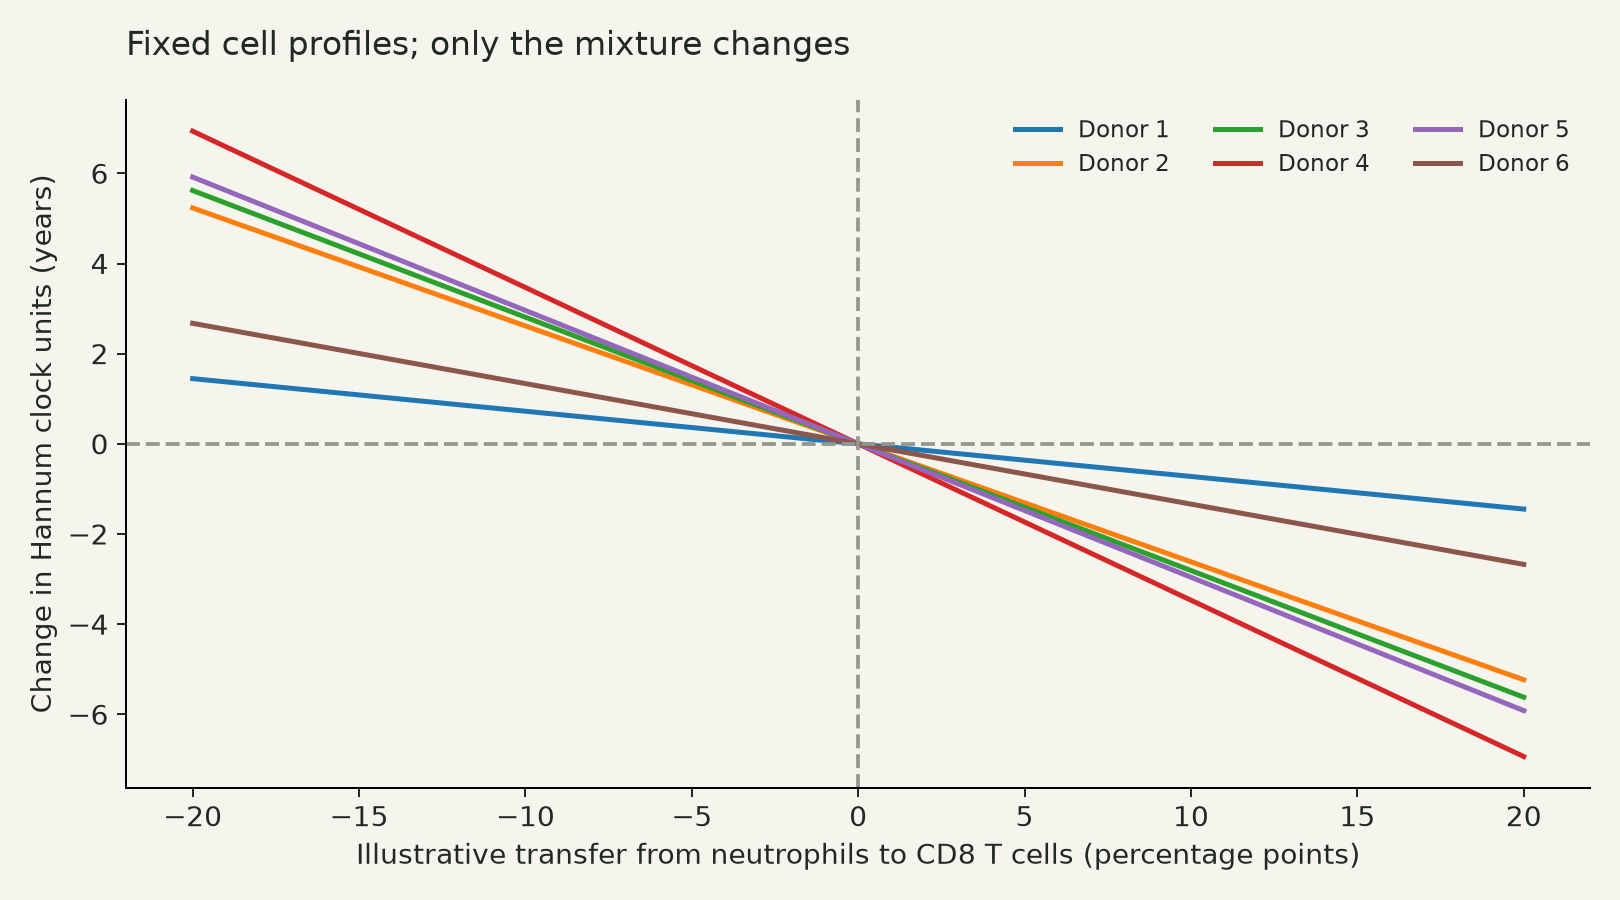
Each line represents one donor. We also calculated 228 donor-specific, directed cell-pair contrasts with complete marker measurements. Results depend on the cell types; the direction above is not a universal rule. Main results · Other cell pairs
Three limitations matter. The 10 percentage-point shift is an illustrative choice, not an estimated intervention effect. Linear mixing assumes DNA contribution fractions; sorting purity, DNA contribution and array preprocessing can make physical samples depart from that approximation. Finally, Hannum readings in sorted cells are not directly validated measurements of those cells' “true ages.”
There is a further identification problem: different mechanisms can produce the same clock change. We constructed a second scenario that keeps cell fractions fixed and makes small within-cell methylation changes. It yields the same score change, with every methylation value remaining between 0 and 1. This demonstrates that a single output cannot uniquely identify the input changes. It does not tell us which scenario occurred in a person. Concurrent cell counts, sorted or single-cell measurements, and experiments tied to functional outcomes would help distinguish the paths.
Composition changes can themselves be beneficial or harmful biology. An intervention may work partly by changing immune populations. Consequently, the total intervention effect and an effect adjusted for post-treatment cell composition answer different questions. Adjusting for a mediator does not automatically identify an unbiased within-cell direct effect.
What we could actually reanalyze in CALERIE
CALERIE randomized 220 healthy adults without obesity to a calorie-restriction intervention or an ad libitum control condition for two years. The methylation analysis was conducted after the trial and was not an original registered primary endpoint. Its biomarker analysis included 197 participants with baseline and at least one follow-up measurement. The paper reported a small DunedinPACE reduction and no clear between-arm effect on PC PhenoAge or PC GrimAge. Paper Trial registration
We obtained the public CSV exports and supplementary PDF, not the complete raw array data. There are 580 exported rows, seven without clock values, leaving 573 measurements: 197 at baseline, 191 at 12 months and 185 at 24 months. Shared values in the two public exports agree row by row. The note to Supplementary Table S1 gives 65 controls at 12 months; the data and main Figure 1 give 66. We retained the 66 observed records rather than deleting one to match that note. Supplement Data access
The export contains no participant identifier, age, sex, study site or cell fractions. A suggestive row order does not establish participant linkage. We therefore computed an independent-arm mean contrast at each follow-up, using Welch intervals, without claiming to reproduce paired changes, baseline adjustment or cell mediation.
| Follow-up | Our DunedinPACE endpoint contrast, CR minus control [95% CI] | Paper's adjusted contrast, standardized units [95% CI] |
|---|---|---|
| 12 months; 125 versus 66 observations | −0.024 [−0.049, 0.001] | −0.29 [−0.45, −0.13] |
| 24 months; 117 versus 68 observations | −0.021 [−0.045, 0.004] | −0.25 [−0.41, −0.09] |
The right column is attributed to the authors' Table S4, not our computation; the columns use different units. Multiplying by the reported rounded baseline SD of 0.09 gives approximately −0.026 and −0.023 DunedinPACE units for the paper's point estimates. These are similar in direction and magnitude to our contrasts. All computed contrasts
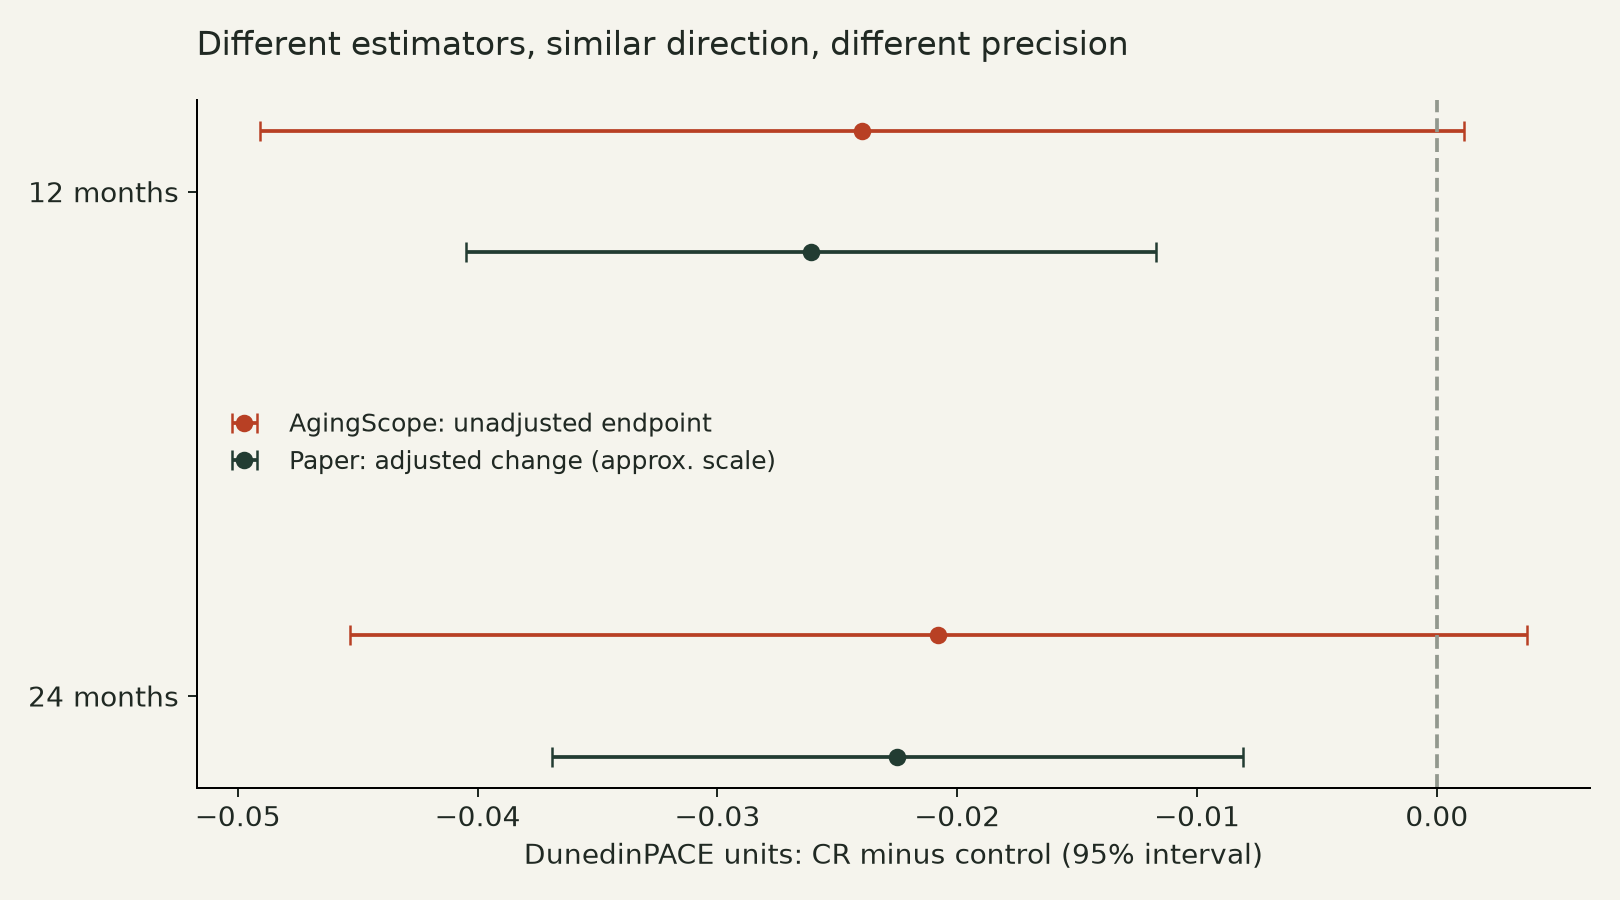
Our intervals crossing zero do not refute the paper. The original model used baseline, covariate and repeated-measure information that our analysis cannot use. The methods and precision differ. Randomization supports between-arm comparisons, but available-case estimates still depend on missingness; this is not a complete intention-to-treat replication. We show all three main-paper clocks at both follow-ups, apply Holm adjustment to that six-test family, and separately export all eleven clocks with a 22-test Holm adjustment. The smallest P value is not selected as our headline result.
Within-arm changes answer a different question. In Table S3, the PC GrimAge age-difference score declines in both arms at 24 months; the adjusted between-arm estimate in S4 is near zero. Reporting only the intervention arm's decline would discard the control explanation. A decline in an age-difference score also need not mean that raw clock age moved backward. Tables S3–S4
How different would missing outcomes need to be?
Using the full randomized denominators of 145 and 75, the public 24-month measurements omit 28 intervention and seven control participants. If the unobserved controls had the observed control mean, a mean DunedinPACE about 0.108 higher among unobserved intervention participants than observed intervention participants would bring the unadjusted full-arm point contrast to zero. Restricting the denominator to the 197-person biomarker cohort gives a corresponding offset of about 0.242. Sensitivity calculations
These are assumptions to explore, not recovered outcomes or a sensitivity analysis of the authors' adjusted model. They show how missingness assumptions and denominators affect our simpler estimate. The export does not establish which assumption is plausible.
Could cell composition explain the whole CALERIE finding?
We cannot make that claim. In the paper's Table S6, DunedinPACE effects remain negative and similar in magnitude after adjustment for changes in estimated cell counts. This weighs against the simple explanation that those fractions account for everything. Estimated counts are imperfect, do not capture every subpopulation and are not direct measurements of within-cell processes. Our Hannum mixture example neither cancels this counterevidence nor quantifies the composition contribution to DunedinPACE in CALERIE. Table S6
Two ways an apparent reversal can emerge statistically
First, select unusually high baseline readings and measure them again. We simulated 400,000 unchanged latent scores with SD 2 and independent assay errors with SD 2. Both parameters are illustrative. Among the top 10% of initial readings, the second reading fell by an average of 2.49 units; the normal-model analytic expectation is 2.48. Selection enriched the first measurements for positive noise, without any true improvement.
If each independent assay error has SD σ, the error in a two-measurement difference has SD √2σ. Averaging r independent technical replicates at each visit reduces this component to √(2/r)σ. This does not include real short-term physiological variation or remove shared batch bias. Chronological-age prediction error cannot be substituted for repeat-assay error in this calculation.
Second, calculate many clocks and select a significant result. When every null hypothesis is true, sixteen two-sided tests using P<0.05 without correction produced these probabilities of at least one false positive in either direction:
| Correlation between test statistics | Simulated probability of at least one false positive |
|---|---|
| 0 | 56.0% |
| 0.5 | 37.3% |
| 0.9 | 14.6% |
| 1.0, identical tests | 5.0% |
Each scenario used 200,000 simulated experiments; the largest Monte Carlo standard error was about 0.11 percentage points. The independent-case calculation, 1−0.95¹⁶ = 56.0%, agrees with simulation. This is an equicorrelated Gaussian illustration, not an estimate of the false-positive rate of sixteen actual clocks.
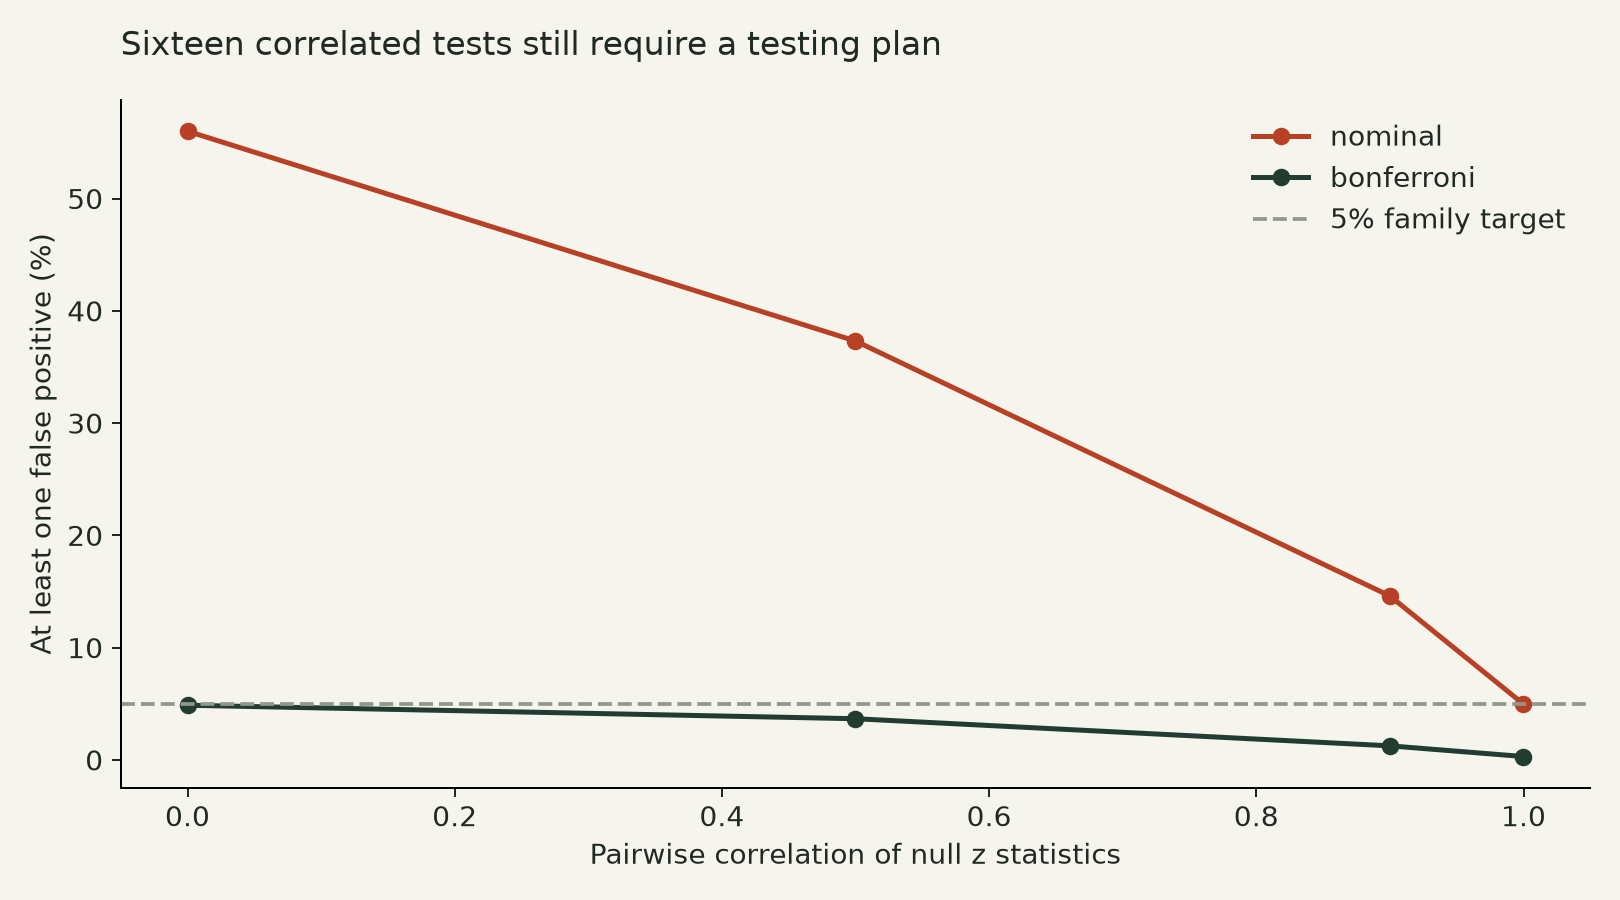
Correlation reduces redundancy but does not automatically turn multiple tests into one. Bonferroni's bound follows from the probability union bound and does not require independence; it can be conservative with strong correlation. Multiplicity control, specifying primary clocks in advance, reporting all outcomes and independent replication address different problems. Simulation results and uncertainty
Improving repeatability can help. In a separate illustrative setting with 50 people per arm, a true change contrast of 0.5, biological-change SD 1 and assay-error SD 2, increasing technical repeats from one to four at each visit raises analytic power from 13.3% to 30.3% for a two-sided known-variance test. Simulation agrees. This demonstrates a noise-reduction benefit, not a sample-size recommendation for a real trial. Parameters and power results
Has newer evidence closed the gap?
In August 2026, Sehgal and colleagues analyzed 51 public and private longitudinal intervention studies, comparing sixteen clocks and additional methylation measures. More reliable second-generation and pace measures often appeared responsive. This expands the map of responsiveness; the central analyses include pre/post comparisons, so the cross-study response rankings are not randomized comparisons of treatment efficacy. Clocks sharing samples or signals are not independent clinical replications. Responsiveness that remained after the authors' cell-fraction adjustment is also evidence to retain. Sehgal et al., 2026
A 2026 InCHIANTI analysis of 699 participants found that changes in several clocks, considered jointly with baseline values, were associated with mortality. This moves closer to asking whether change carries health information. It remains observational: naturally occurring differences and intervention-induced changes need not have the same causal meaning. It strengthens the case for further validation without completing surrogate endpoint validation by itself. Kuo et al., 2026
It would therefore be too strong to claim that clock changes carry no health information. It would also be too strong to convert them into established longevity gains. The missing bridge is specific to a population, intervention and measure: do prespecified changes reliably predict functional, disease or survival benefits across appropriately designed trials, and are there counterexamples where the reading improves while harm increases? Surrogate validation
Which experiments would change the judgment?
For the cellular mechanism, a discriminating design would measure whole-blood methylation, cell counts and important sorted populations within a randomized trial. Report the total effect, then examine composition and within-cell changes as separate questions, without defining either as noise in advance.
For measurement, distribute samples appropriately across assay batches, retain blinded technical replicates and report absolute differences between replicates, not only correlations. A wide age range can produce high correlation while small within-person changes remain uncertain.
For health meaning, prespecify a limited set of primary measures, report negative findings, examine persistence after treatment stops and follow actual function, disease and safety outcomes. Stronger interpretations require these additional connections.
CALERIE's safety report also shows why a favorable marker cannot settle overall benefit and harm. The intervention included nutritional and safety monitoring; bone-density declines occurred, and some participants discontinued the intervention because of persistent hematocrit reductions or excessive bone loss. This article does not assess calorie restriction for an individual or turn clock results into a diet prescription. Safety report
Research notes, reproduction and updates
This is a scoped evidence investigation with exploratory computation, not a systematic review or a new laboratory experiment. Searches through September 17, 2026 used publisher pages, PubMed/Europe PMC, GEO, supplementary materials and ClinicalTrials.gov to follow trials, counterevidence, methods and recent developments. We did not obtain the complete linkable CALERIE dataset, reanalyze all 51 studies or validate a commercial service.
Download the reproduction package: code, pinned dependencies, input URLs and hashes, Hannum weights with their license, analysis decisions and output documentation. The code retrieves original inputs from public repositories; participant-level data and full papers are not redistributed in the package. Machine-readable results
The CALERIE computation uses published, processed measurements. The cell model combines measured reference profiles with chosen mixture fractions. Noise, multiplicity and power calculations use synthetic data. Independent formulas, boundary cases, agreement between exports and fixed random seeds check implementation; they are not additional experimental validation.
This article updates Changshou.wiki's existing epigenetic-clock entry. It retains the measurement and prediction questions, narrows claims about “true age” and clinical utility, and adds between-arm statistics, mechanism calculations and 2026 evidence. Previous intervention rankings and personal testing suggestions are outside this version's conclusions. First release of this version: September 17, 2026. Next planned search review: March 17, 2027, or earlier after a major trial, correction or access to linkable data.
Authorship, computation, translation checking and editorial approval were performed by the same Codex AI agent. There was no independent agent, human or clinical professional review. Reading scopes, interests and remaining limitations are listed below.
Explore the mixture and noise models. The interactive illustration neither collects personal health information nor predicts an individual's outcome.
MODEL EXPLORER
Change the assumptions. Watch the reading.
An illustration using measured cell profiles and chosen fractions. It does not predict personal age or intervention benefit.
Starting mixture 80:20. Cell methylation profiles stay fixed.
Hannum years
SD of the error in the change:
sqrt(2 / repeats) × SD. Independent errors only; shared batch bias and biological variation are excluded. Noise assumptions are not calibrated to the reference donors or a commercial assay.
JavaScript is off. The full scenario results and assumptions remain available in the article and downloadable tables above.
Scope & limitations
- This is targeted evidence research and exploratory computation, not a systematic review or a new trial.
- The public CALERIE export lacks reliable subject identifiers and covariates; endpoint comparisons are not a full replication of the longitudinal model.
- The mixture model uses six male donors and a fixed linear algorithm; chosen fractions are not observed intervention changes or CALERIE attribution.
- Synthetic noise parameters do not establish the performance of a commercial test or individual diagnosis.
- The same AI agent authored, self-reviewed, translated and approved the article; no independent or clinical professional review occurred.
Sources
- Waziry et al. Effect of long-term caloric restriction on DNA methylation measures of biological aging in healthy adults from the CALERIE trial
Primary research · Source version: 2023; PMC version retrieved 2026-09-17
Reading scope
Relevant sections
Read results, sampling, assay processing, ITT/TOT models, limitations and disclosures. Checked public supplements separately; original individual-data model not rerun.
- Fig. 1; Results; Methods: DNAm data and Analysis; Discussion; Competing interests
- CALERIE Supplementary Information: Tables S1–S10 and figures
Primary research · Source version: 43587_2022_357_MOESM1_ESM.pdf
Reading scope
Relevant sections
Read S1–S6 for denominators, ICC versus repeat stability, scaled change scores, adjusted estimates and cell-count adjustment. S1 12-month AL note conflicts with CSV/main figure.
- PDF pages 2–10: Tables S1–S6
- CALERIE public source-data and supplementary-data exports
Dataset · Source version: Retrieved 2026-09-17; input SHA-256 in reproduction package
Reading scope
Relevant sections
Inspected all CSV column names and missingness; computed files MOESM3 and MOESM5, checked shared values. 580 rows, 573 observed clock rows, no subject IDs.
- MOESM3/MOESM5 CSV headers and all analysis rows; MOESM4/MOESM6 model summaries
- Reinius et al. Differential DNA methylation in purified human blood cells
Primary research · Source version: 2012; Europe PMC XML
Reading scope
Relevant sections
Read donor design, sorted-cell results, purity and assay processing. Six male donors are not a representative reference population.
- Results: DNA methylation of blood cell populations; Methods: participants, purification, methylation analysis
- GSE35069: purified human blood-cell methylation profiles
Dataset · Source version: GEO processed matrix downloaded 2026-09-17
Reading scope
Relevant sections
Inspected sample metadata and extracted all 71 clock markers, including ch.* markers. Main neutrophil/CD8 profiles complete; other incomplete pairs omitted explicitly.
- Series/sample metadata; 71 selected marker rows across 60 samples
- HigginsChenLab methylCIPHER: Hannum implementation and coefficients
Algorithm · Source version: Commit bfe5d02817e7dd5e923e8bf96528d5bfd52e1636
Reading scope
Relevant sections
Read calcHannum.R, all coefficient entries and BSD-3-Clause license; pinned files verified byte-for-byte. Implemented weighted sum independently, without refitting.
- R/calcHannum.R; data/Hannum_CpGs.rda; LICENSE
- Belsky et al. DunedinPACE, a DNA methylation biomarker of the pace of aging
Primary research · Source version: 2022; Europe PMC XML
Reading scope
Relevant sections
Read development target, repeatability, validation and limits. No recalculation of the DunedinPACE CpG algorithm or commercial-test validation.
- Results: developing DunedinPACE and test-retest reliability; Discussion: limitations
- Sehgal et al. Responsiveness of epigenetic aging biomarkers to longevity interventions in humans
Primary research · Source version: Version of record 2026-08-21; retrieved web sections 2026-09-17
Reading scope
Relevant sections
Read data pipeline, pre/post comparisons, cell-adjustment findings, multiplicity methods and access limits; 51 studies were not reanalyzed. Supplementary workbooks were not obtained. Disclosures checked in a separate saved extract.
- Results: data curation and responsiveness; Methods: age residuals, paired tests, multiple testing; data availability
- Kuo et al. Longitudinal changes in epigenetic clocks predict survival in the InCHIANTI cohort
Primary research · Source version: Version of record 2026-03-13
Reading scope
Relevant sections
Read 699-participant design, baseline/slope models, results and limitations. Observational associations do not validate intervention-induced changes as surrogates; no raw-data replication.
- Main; Figs. 2–3; Methods: Statistics and reproducibility
- FDA–NIH BEST: Validated Surrogate Endpoint
Methods reference · Source version: Updated 2020-11-13; retrieved 2026-09-17
Reading scope
Relevant sections
Read definition and explanation, including context specificity and the distinction between individual correlation and trial-level surrogacy.
- Definition; Explanation
- Romashkan et al. Safety of two-year caloric restriction in non-obese healthy individuals
Primary research · Source version: 2016; Europe PMC XML
Reading scope
Relevant sections
Read safety surveillance, discontinuations, adverse events, bone-density and hematocrit findings. Safety analysis denominator 218 differs from methylation paper randomization denominator 220.
- Results: adverse events, anemia, bone density; Discussion; Methods
- NCT00427193: CALERIE trial registration
Trial registration · Source version: API retrieved 2026-09-17; last posted update 2022-03-16
Reading scope
Relevant sections
Read original study identity, dates and current registered outcome fields. Methylation clocks are not listed as original primary outcomes in this record; no full historical version audit.
- protocolSection.identificationModule; statusModule; outcomesModule
- methylCIPHER Hannum coefficient file
Algorithm · Source version: Same pinned commit as s6
Reading scope
Relevant sections
All 71 coefficient entries read after R-data conversion; source hash retained.
- Hannum_CpGs Marker/Coefficient columns
- Sehgal et al.: competing interests declaration
Primary research · Source version: 2026-08-21
Reading scope
Relevant sections
Read patent, consulting and company-employment disclosures; used to contextualize, not dismiss, the findings.
- Competing interests
Authorship & review
Author self-review · Codex (AI agent)
2026-09-17 · Same-author review of primary sources/supplements/registration, estimands, denominators, all 71 clock markers, analytic checks, model boundaries, translation and safety scope.
Remaining limitations:
- This is targeted evidence research and exploratory computation, not a systematic review or a new trial.
- The public CALERIE export lacks reliable subject identifiers and covariates; endpoint comparisons are not a full replication of the longitudinal model.
- The mixture model uses six male donors and a fixed linear algorithm; chosen fractions are not observed intervention changes or CALERIE attribution.
- Synthetic noise parameters do not establish the performance of a commercial test or individual diagnosis.
- The same AI agent authored, self-reviewed, translated and approved the article; no independent or clinical professional review occurred.
Editorial approval · Codex (AI agent)
2026-09-17 · Checked the current English text, summary, figures, source interpretation and boundaries; author also acts as editor. Deployment remains subject to website acceptance and the task quality threshold.
Translation check · Codex (AI agent)
· Same-agent comparison of all findings, numerical values, units, uncertainty, scope, captions and disclosures against Chinese; no independent language review.
Funding & interests
Prepared for the user-commissioned AgingScope project. No product sales or referral links in this article. The project owner’s complete financial relationships were not audited; this statement is not a certification of independence.
Funding of cited research
CALERIE reports NIH and other support and DunedinPACE invention/licensing interests. Sehgal et al. disclose SystemsAge patents, consulting for TruDiagnostic and other firms, and company employment. Disclosures inform interpretation; they do not alone determine whether findings are valid.